How to create a BI platform using Apache Superset
Learn how to create a powerful and extensible business intelligence (BI) platform for your ecommerce business using Apache Superset.

Apache Superset is a new “enterprise-ready” web application for building business intelligence (BI) applications and dashboards. Developed by the team that built Airbnb using the Flask Python framework, React JS, and Bootstrap, Superset lets you connect to a huge range of databases and other data storage systems, such as MySQL, BigQuery, Google Sheets, SQL Server, PostgreSQL, ElasticSearch, Apache Spark, and many more.
Superset can be used to create standardised dashboards, or allow “power users” to create their own dashboards or reports using SQL queries. The overall concept is similar to that of Power BI, Qlik, Tableau in that it allows data exploration, data visualisation, and reporting from several systems at once. It’s not designed to replace a data warehouse (see Apache Druid) and it won’t periodically fetch data from other sources (see Apache Airflow), but it’s really good for BI.
At present, Apache Superset is still classed as “incubating”, which means it’s in the early stages of development and is missing some features found in other platforms. However, it’s free, open source, and improving quickly. It’s fairly robust, but isn’t perfect yet.
Here, I’m going to show you how to set up Apache Superset on an Ubuntu Linux workstation using Docker, connect it to a MySQL database and create an example ecommerce dashboards for business intelligence.
Install Superset via Docker
Since it’s written in Python, Apache Superset can be installed as a Python package by entering pip3 install
superset. However, as it effectively runs on its own server, I’m going to use Docker to containerize Apache
Superset instead. This will neatly separate Superset and provide a local web server address through which you can access the web interface.
At present, there’s no official Docker container on Docker Hub. However, there are lots of unofficial ones and it’s
not too tricky to build your own. The project founder, Airbnb’s Maxime Beauchemin, has made a Superset container available via his Preset company. If you enter the command docker run -d -p 8080:8080 --name docker_superset preset/superset Docker will fetch the latest version of Superset from the Preset Docker Hub page and create a container called docker_superset that you can access on port 8080 of your localhost (once setup has been completed).
docker run -d -p 8080:8080 --name docker_superset preset/superset
Create an administrator account
To login to Superset you will need to create an admin account. You can set this up by executing a command directly to Superset using docker exec. Adapt the parameters below to match your preferred credentials. Don’t try logging in with it just yet, as there are some additional steps to follow to get the database backend working.
docker exec -it docker_superset superset fab create-admin \
               --username matt \
               --firstname Matt \
               --lastname Clarke \
               --email name@example.com \
               --password SecretPasswordHere
Set up the database and load some example data
Superset uses SQLite as its internal database for storing settings and configuration so you will need to get this ready first.
It also comes with some example charts and dashboards, which are a great way to understand what you can do with the platform and get some inspiration for dashboards. It’s really powerful and, as you can build your own visualisation plugins, and even create custom themes using Bootstrap, the possibilities are massive.
docker exec -it docker_superset superset db upgrade
docker exec -it docker_superset superset load_examples
Set up user roles
The final step before you can login is to set up the user roles using superset init. If you attempt to login to Superset before running init you’ll see various “An error occurred” message alerts. The init command initialises roles for the administrator and other users, which allows you to control what users can see and do with Superset.
docker exec -it docker_superset superset init
Now you can visit http://localhost:8080/login and log in using the credentials you defined above.
Adding data sources to Apache Superset
Superset can handle a massive range of data sources, as well as uploads from CSV. However, the only data source connector that comes bundled with Superset is the one used for its internal SQLite database. If you want to extract data from MySQL, MSSQL, BigQuery, Google Sheets, and Elastic, you’ll need to install the driver for each one. This is a little bit more work, but it means you get a custom Superset build and it cuts down on code bloat.
All of the data source connectors can be installed via PyPi by entering a pip install command on the Docker container. If you’re building a Superset container to deploy or re-use, you can also put these commands into a Dockerfile and run all of the required build steps to set up your Superset container just the way you want it.
Install data source connectors
I have another Docker container in which I run my MySQL databases on my data science workstation. To connect to this, I first need to install the data source connector. These connectors all work using SQLAlchemy, so might already be familiar to you if you use this excellent package. SQLAlchemy creates a connection string called a URI which defines the data source, the username, password, server address and port number and the name of the database to use. First, we’ll use docker exec and create an interactive shell with -it on the docker_superset container and fire up Bash as root.
docker exec -it --user root docker_superset bash
Once you’re logged in via Bash you can execute commands directly on the Linux host in which Superset is running.
First we will upgrade Pip to the latest version, then install the pymysql connector, the one for Google Sheets,
and the one for Apache Druid, so we can use them in the future.
pip install --upgrade pip
pip install pymysql
pip install gsheetsdb
pip install pydruid
The downside of using SQLAlchemy connectors for everything is that you can’t easily fetch data using REST APIs and pull it into Superset. There are some third party paid plugins that add this functionality, or you could build your own data pipeline using Apache Airflow.
Set up the data source in Superset
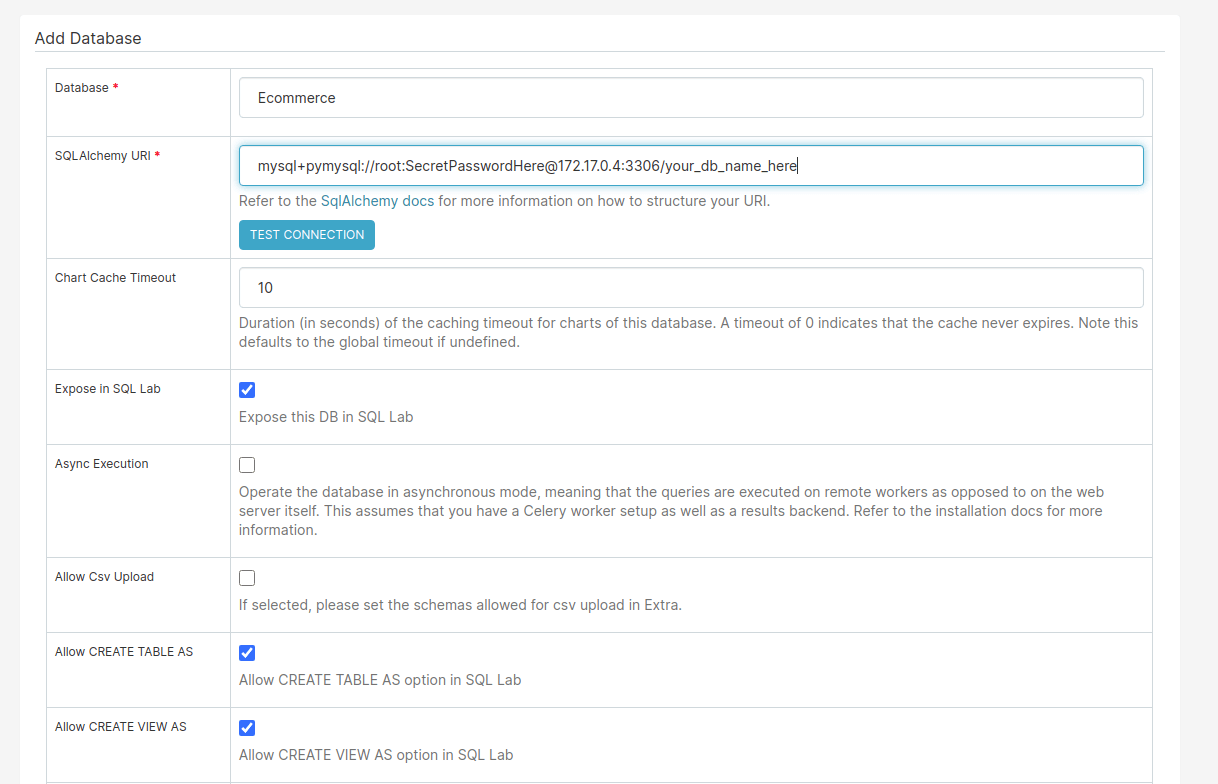
Now go to Superset and click Sources > Databases and click the plus icon in the top right corner, which will take you to a screen that allows you to add a new database. Enter a name for the database, and fill in the SQL Alchemy URI. You can check the database dependencies documentation for more details on how these are setup. They all follow similar naming conventions.
Finally, select what you want to allow users to do with the database. I want to expose my database in the SQL Lab feature, so power users can query it directly, but I do not want them to be able to do be able to DELETE, INSERT, or UPDATE.
You can click the Test Connection button to check the URI works and then save it. Superset gives you the ability to control things at a much more granular level, so if you poke around you’ll see that you’re able to define only specific columns to use and define how they can be queried. It’s very configurable.
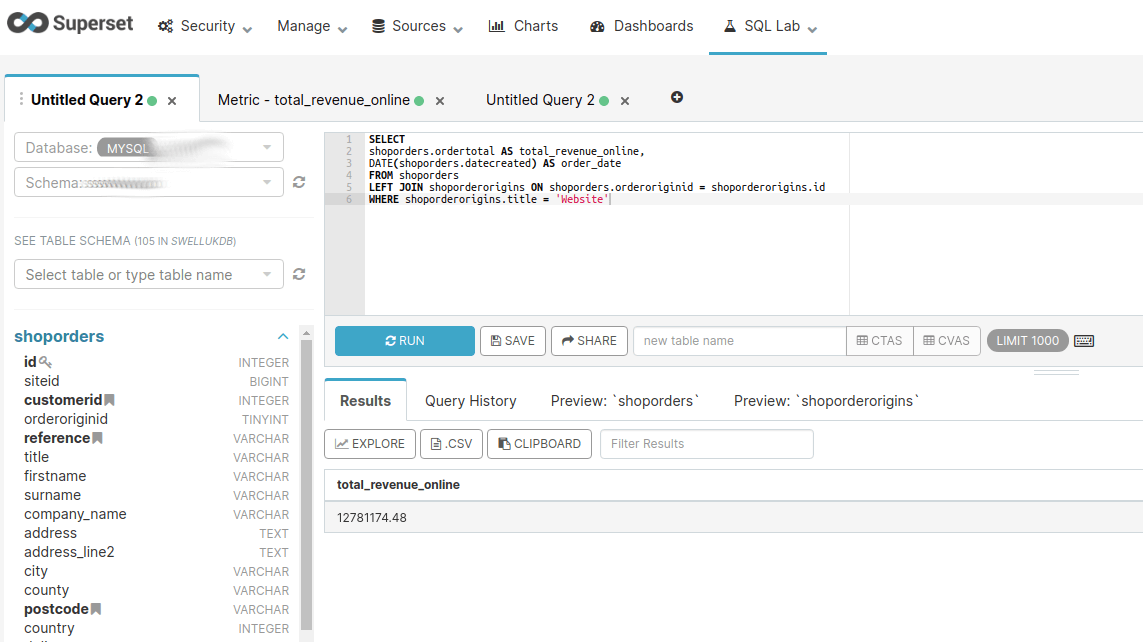
Browse data and write queries in SQL Lab
To check your database connection is working, select SQL Lab from the Superset menu and then click SQL Editor. On the left hand side, select the database you connected and select the database, schema, and table from the list. You’ve now got access to all of the tables, plus a query editor field where you can write and execute queries on the database. If you write a simple query, you can save it to execute later. The queries you write in here can be used to create dashboard widgets, such as tables, charts, metrics, and many other elements.
Creating an ecommerce dashboard in Superset
While you can allow tech-savvy users to run queries in SQL Lab directly on the databases, the vast majority of people won’t understand how to use this feature and will want a regular dashboard instead. You can create dashboards for pretty much anything and combine various data sources on a single page, or use tabs to separate certain parts of the content. There are loads of built-in graphs, charts, and other widgets, such as pivot tables, that you can add. You just need to configure them to load data from one of your pre-defined data sources. They even support caching.
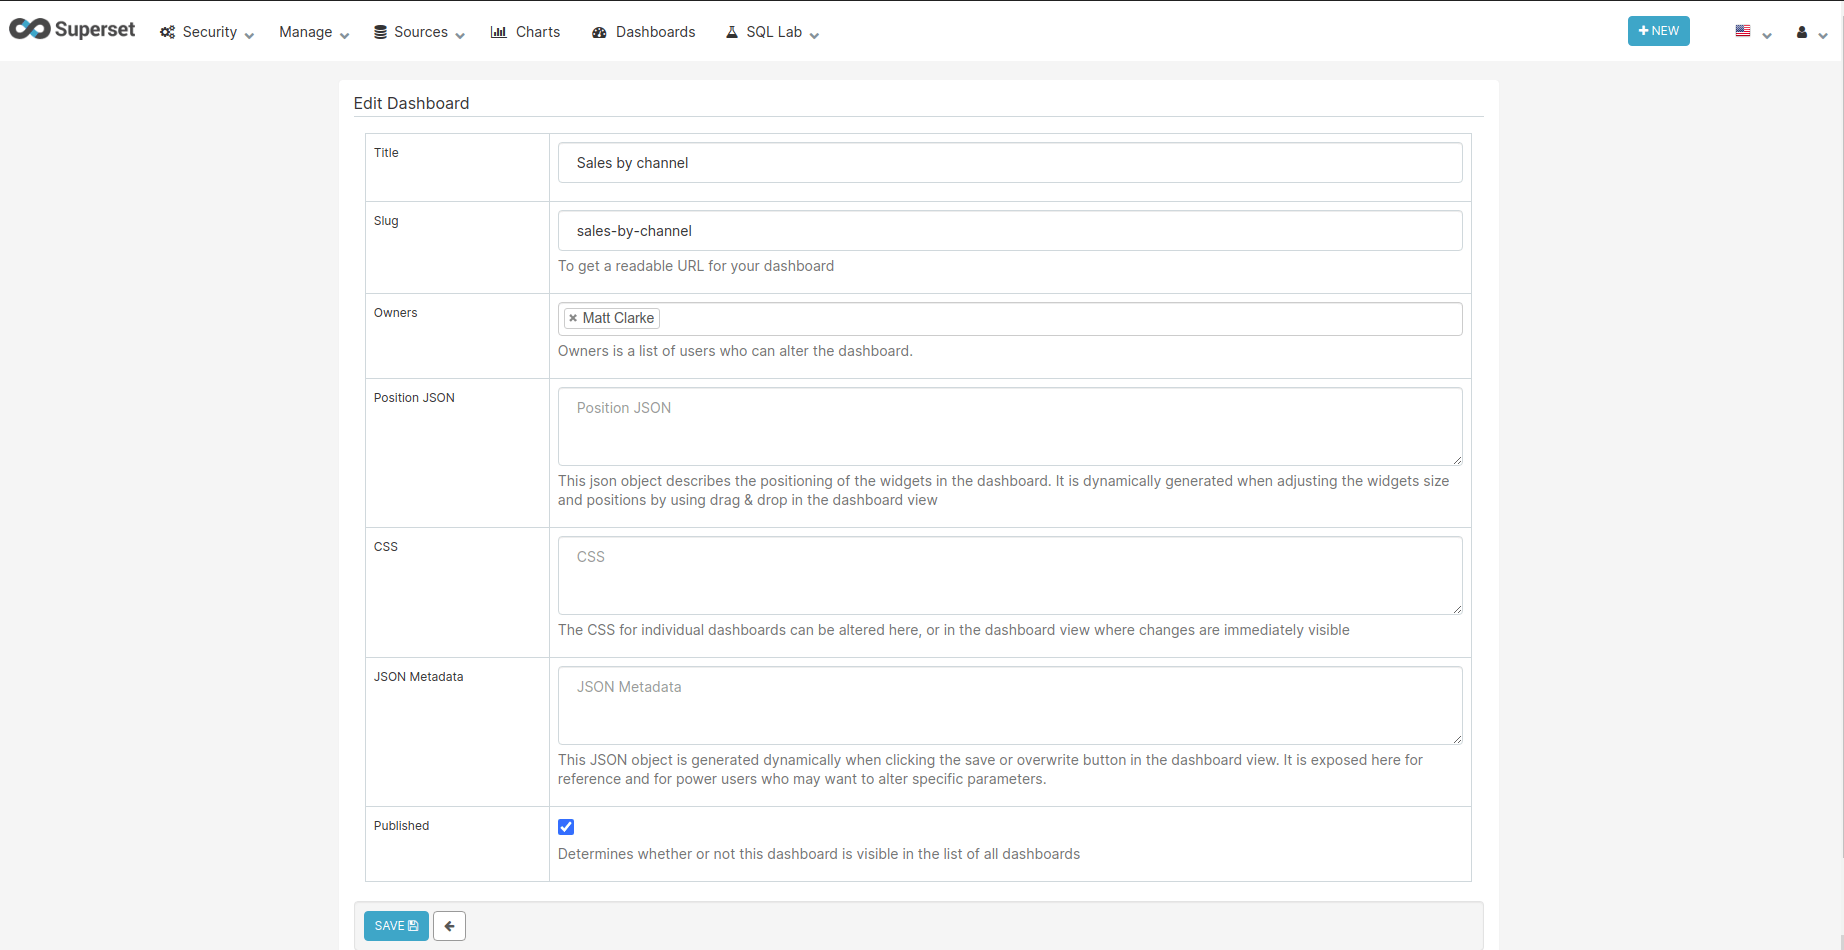
Add a new dashboard
On the main menu of Superset, select Dashboards and then click the plus icon to add a new one. I’m going to create a blank ecommerce dashboard to show the sales for each channel, so have filled in the fields accordingly. Once you’ve configured your dashboard for your needs save it and move on to the next step.
Create a data source
There are a couple of different ways you can provide data to power the visualisations, tables or metrics on your dashboards. You can define a “table” or you can create a custom query (called a “slice”) using SQL Lab. The difference is that when you define a table, you’re able only to query from one table, while with a custom SQL Lab query you can join multiple tables together.
For our “Sales by channel” dashboard I want to show some metrics showing the total revenue for each channel over the past 30 days, plus some time series plots, and some tables of other data. Let’s create the “slices” for the metrics first.
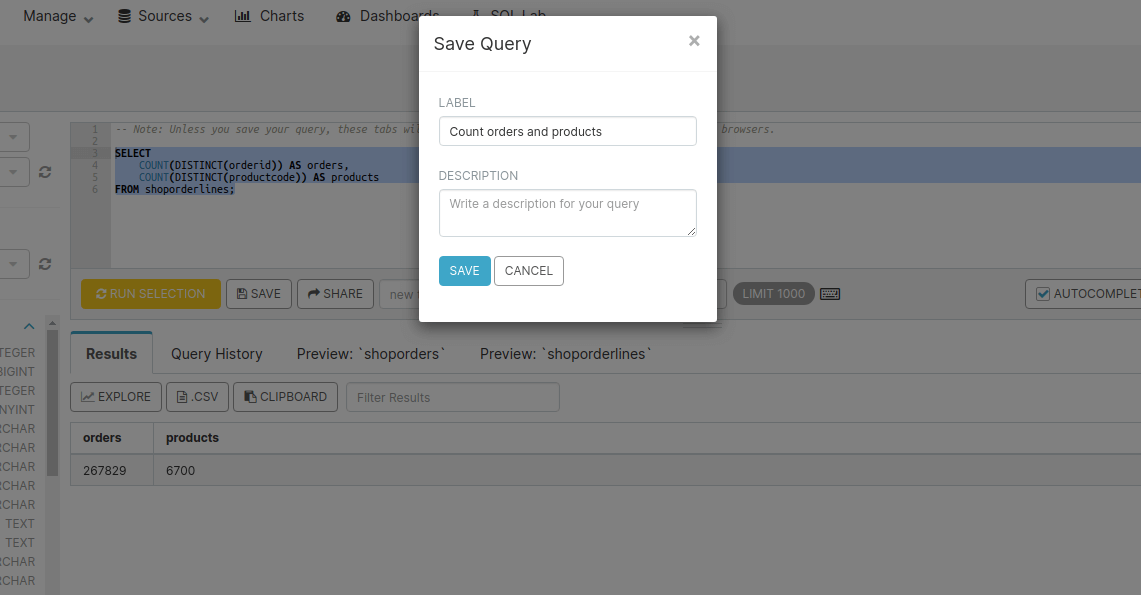
Create a slice
For our metric tiles, we need to write some custom queries on the orders table of our ecommerce database and SUM() the total revenue for each channel per day. To do this go to New > SQL Query and enter the SQL you need to do this. Rather than just returning the metric for a given period, if you select both the total revenue and the date, then you can use Superset to handle the time period. Click Run to test your query and then Save it with a descriptive name when you’re done.
Create the metric tile
All of the tables, charts, metrics, and other visualisations in Superset are made in the same way. Click SQL Lab and then click Saved Queries. Find the query you just saved and click the link icon on the right hand side labeled “Pop Tab Link”. Click the blue Run button and then click the Explore button a short distance below, which should bring you to a page that allows you to configure the chart type. Click the grey button marked “TABLE” under the visualization type heading to see the pre-built visualisations you can apply to your data. Select the one called “Big Number”.
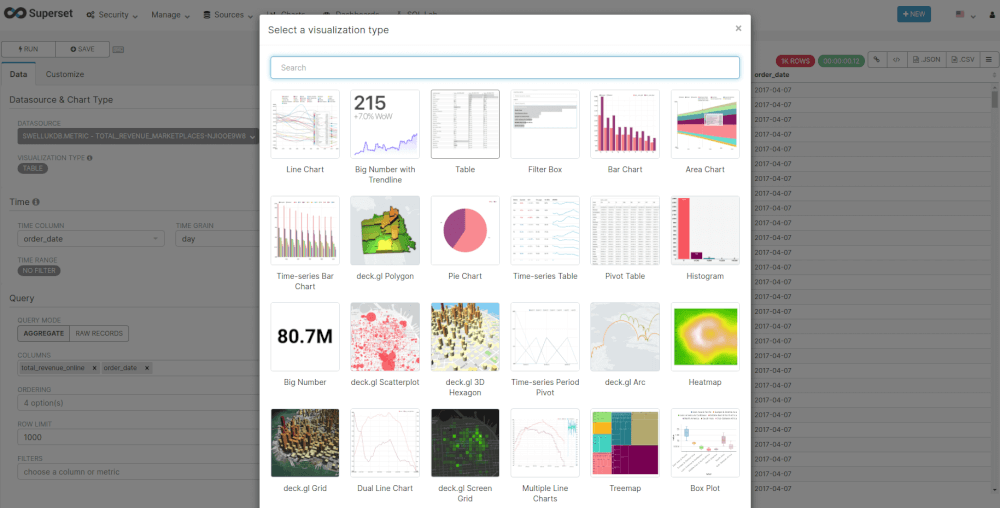
On the main panel, above the metric, click the label and enter a descriptive name, such as “Marketplace revenue.” On the left panel, under Time, click the button below Time Range and set it to last month, then on the Query section, select the value in the Metric field and change it to SUM() so it calculates the sum of revenue during the selected period, then click Run Query to see the data on the tile. Repeat this process for each of the visualizations you want to create.
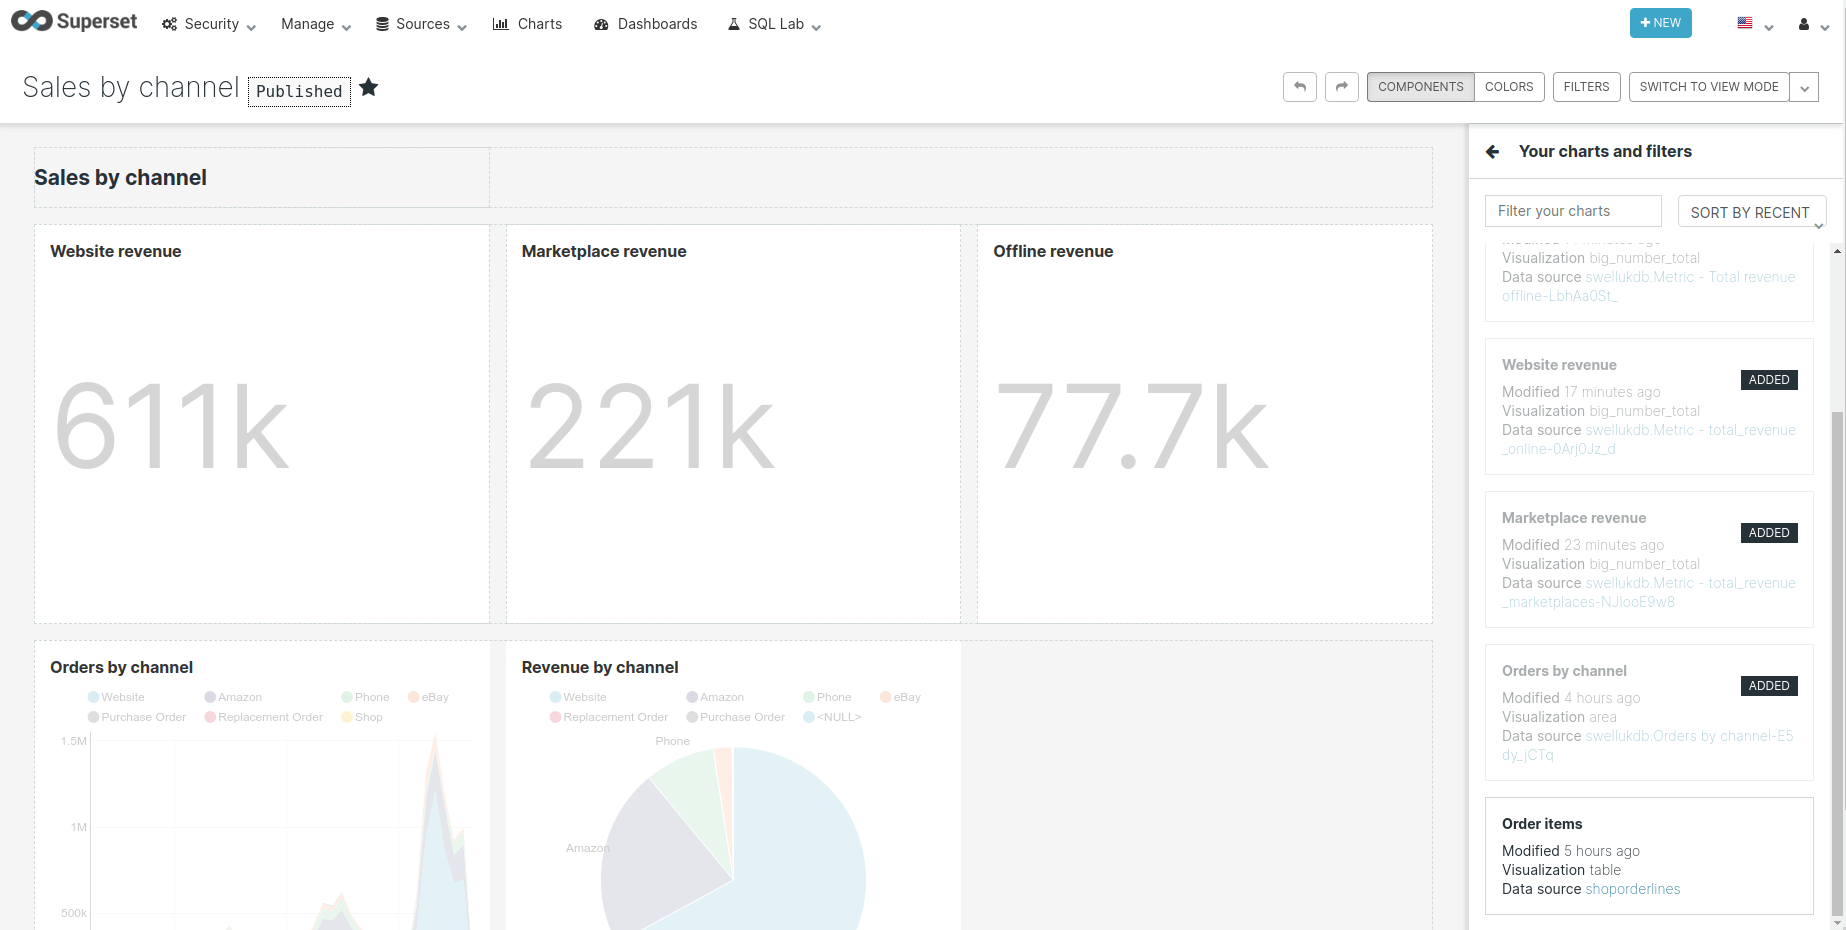
Add the charts to your dashboard
Click the Dashboards button in the top navigation and select the empty dashboard you created earlier, then click the Edit Dashboard button on the right hand side of the page. Drag some rows and columns to the page to create a grid to populate and then click “Your charts and filters.” Drag each chart to the desired spot on your page. You can use the edge tool on each column to change the width using the underlying Bootstrap grid.
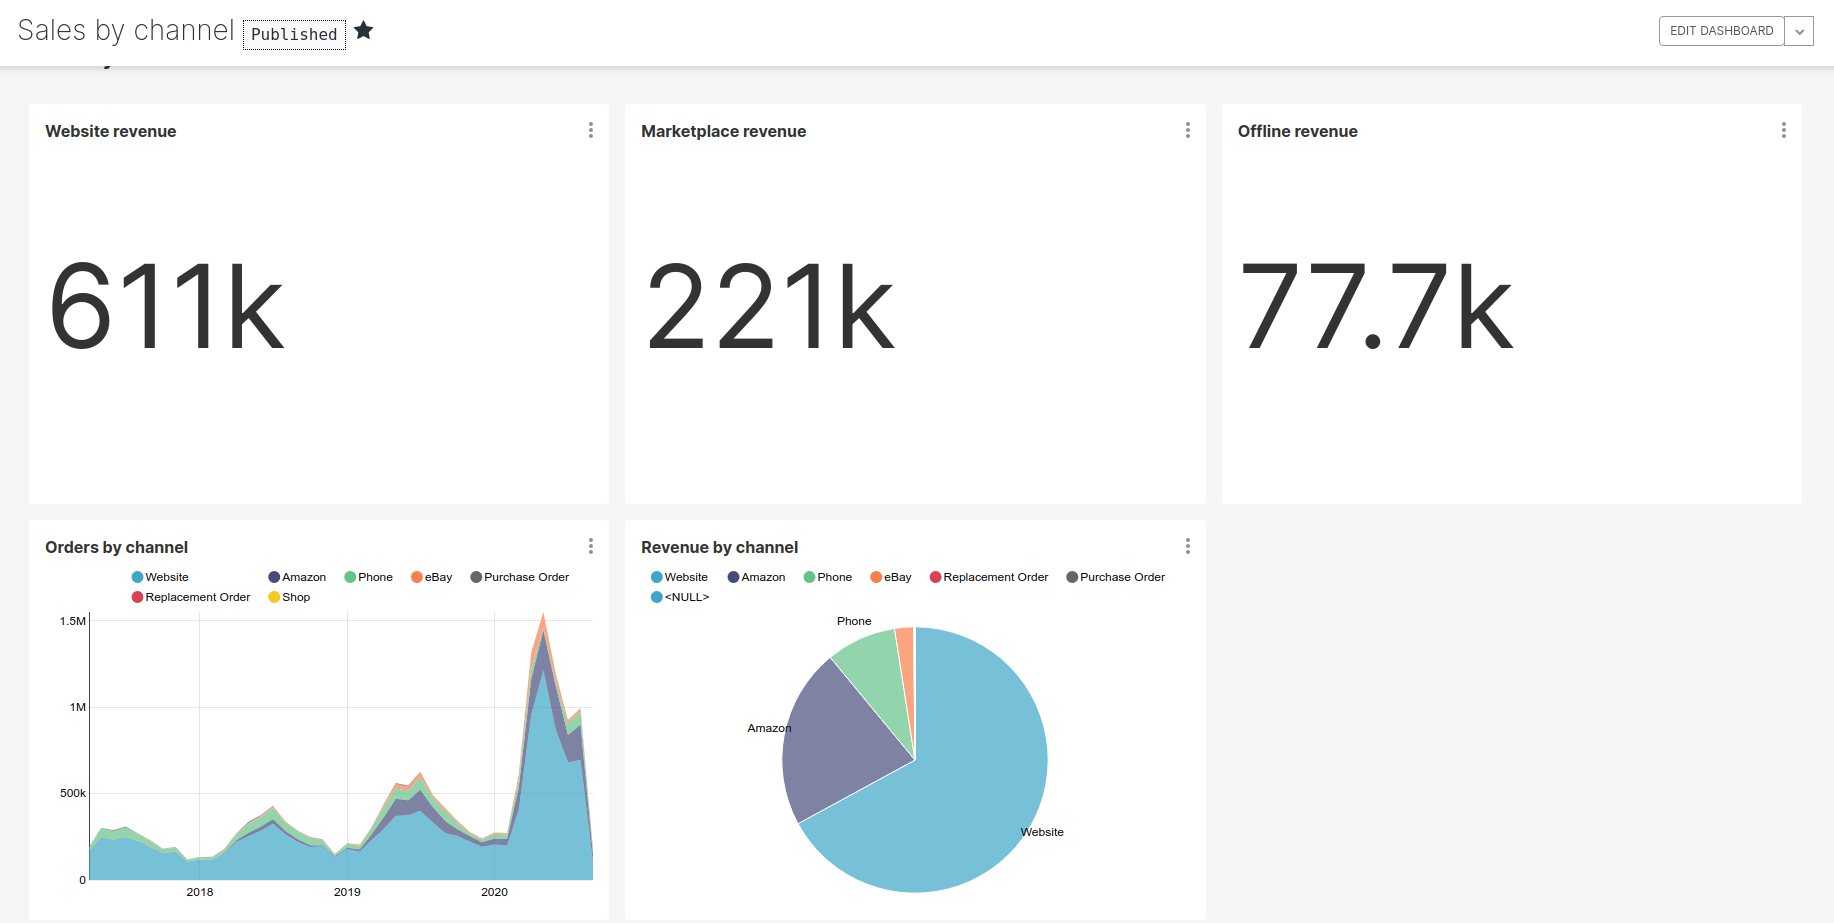
You should now have a simple dashboard containing some metrics and charts showing the sales for each channel on your website. This is only a static example and isn’t particularly interactive. In order to make your dashboard truly interactive you will need to add a filter box. These allow the user to select one or more values from a dropdown menu and tell the dashboard to query the database using the filter selected, allowing a single report to be investigated and queried in a variety of ways.
Hopefully this covers enough of the basics to get Superset up and running and gives you the information you need to get you started in building dashboards of your own.
Matt Clarke, Wednesday, March 03, 2021


Other posts you might like

How to Dockerize a data science application
The phrase “It works on my machine” is a common one in most offices with a data science department. It’s very common to write an application that works perfectly in...

How to backup a MySQL database using mysqldump, SSH and SCP
If you need to create a backup of a remote MySQL database, you can use the mysqldump command. The mysqldump application is known as a client utility and installed alongside...