A quick guide to customer retention
Customer retention rate is one of the most misunderstood marketing metrics. Here's a quick guide to the research in this field to explain what it is and how you calculate it.

There are two main ways you can grow the customer base of a business: you can either acquire more customers by increasing your customer acquisition rate, or you can improve your customer experience and increase the number of customers the business retains.
As customers are constantly being lost due to attrition, churn, or defection, it is vital for a business to top up the losses with new customer acquisitions and try to reduce customer churn. If the customer acquisition rate exceeds the customer churn rate, the overall number of customers will grow. If the acquisition rate is insufficient to top up the customers being lost to churn, then the volume of customers will decline.
As most marketers or ecommerce data scientists are aware, it is generally much more expensive to acquire new customers than it is to retain existing ones, therefore, increasing the customer retention rate is a major objective in most businesses as it can have a significant impact on profits.
In this guide, I’ll cover several competing ways to define customer retention rate, explain the data science techniques used to measure, analyse, and optimise retention, and explain how you can build the underlying models required to measure retention rate properly.
What is customer retention rate?
Customer retention rate, like Customer Lifetime Value (CLV), is one of those unusual marketing metrics that businesses say are critical to their success but that are actually quite poorly defined and rarely measured in a consistent manner.
One very interesting study on customer retention metrics was undertaken by Aspinall et al. (2001). They surveyed UK businesses (including online retailers) to see if they considered retention a critical marketing metric and asked them if they could define it or measure it. Surprisingly, most could not.
“Many companies that claim to consider customer retention as an important business objective do not define it well or measure it. On this basis, companies’ claims to focus on customer retention need to be treated with a pinch of salt”, Aspinall et al. (2001).
When companies were asked to define customer retention, most of them gave quite vague answers, which would impact their ability to calculate it. If you can’t define something clearly, then data scientists or marketers are going to struggle to implement it mathematically to create customer retention metrics for the business to track.
There are many definitions of customer retention in the academic literature, but most of them are rather vague, and wouldn’t make it easy for a data scientist to use the definition to implement a metric a business could use. My preferred metric is the one proposed by Farris et al. (2010), who define customer retention rate as follows:
“Customer retention rate is the ratio of customers retained to the ratio of customers at risk of churning”, Farris et al. (2010)
Farris’ definition of customer retention rate is one of the few to actually suggest how it ought to be calculated. However, it can make it sound quite simple to understand and easy to generate, but the reality is rather different and many businesses may struggle to calculate retention rate correctly.
 Picture by Kampus.
What makes customer retention rate hard to calculate?
If we go back to Farris’ definition of retention we’ll see that it requires two values:
- The number of customers retained
- The number of customers at risk of churning
These two figures are easier to obtain in contractual businesses, because you can easily see how many customers you have by counting the number of active subscriptions or contracts. Similarly, the number at risk of churning might crudely be considered as those customers whose contract expires the following month.
However, neither metric is easily available to those in non-contractual settings, such as ecommerce businesses, or in environments where the customer isn’t tracked - such as most bricks-and-mortar retail stores. Most articles you’ll read on customer retention tend to skirt around this important point.
The reality is that customer retention is actually very challenging to calculate in non-contractual settings and extremely difficult in retail, unless you have the benefit of a loyalty card to help you track customers better.
In order to calculate customer retention rates correctly, you will really need a customer churn model, and these are beyond the capabilities of most marketers. As a result, it’s very common to see customer retention rates being calculated differently (or incorrectly) in articles and even in off-the-shelf customer analytics software.
What models are needed to calculate customer retention?
Customer retention rate is most commonly applied to the measurement of retention of existing customers in contractual situations and is harder to apply to non-contractual settings, such as traditional or online retail, primarily due to the complexities surrounding its measurement outside contractual businesses.
Since customer retention rate is defined as “the ratio of customers retained to the ratio of customers at risk of churning” (Farris et al., 2010) you obviously need to be able to measure the number of retained customers and the number of customers at risk of churning to calculate it.
The only way to accurately obtain those metrics is by building a customer churn model. These aren’t trivial to create. Customer churn models are divided into two main categories: contractual churn models and non-contractual churn models.
Neither model calculates the actual retention rate, as defined by Farris, but will identify which of your customers are still customers and which are likely to churn, so you can more easily calculate the metric.
Contractual churn models
Contractual churn models are designed for businesses where customers have a contract or subscription, such as an insurance or telecommunications provider. These models are classifiers that aim to predict whether a customer will churn or will be retained based on a set of features that describe them, their usage of the service, the charges they’ve paid, and their experiences with the company and its customer service department.
As you might imagine, happy customers tend to be those who’ve used the service without issues or have had any problems resolved quickly and politely through service recovery. Disgruntled customers will be those who’ve had problems with the product or service that haven’t been adequately resolved.
A wide range of popular machine learning classification algorithms can be incorporated into contractual churn models, but the most effective are typically tree-based or gradient boosting algorithms, including decision trees, random forests, XGBoost, and Catboost, as well as ensemble models and stacking models that combine various algorithms in a single model.
Recent machine learning research covering contractual churn models has demonstrated their ability to reach very high levels of accuracy - often up to 96% - typically through the use of ensemble models.
For further information, check out my step-by-step guide to creating a contractual churn model.
Non-contractual churn models
Non-contractual churn models are used in businesses where there is no contract but where customer data is held, such as online retail, or in traditional retail when loyalty cards record individual customer usage. They’re much more complicated to understand and implement than contractual churn models, and are actually quite rarely used, especially in small to medium-sized companies.
Non-contractual churn models also require the use of complex machine learning algorithms, but unlike contractual churn models, they don’t use classification algorithms, because the time of a customer’s “death” (in Customer Lifetime Value terminology) isn’t known in non-contractual businesses.
In non-contractual settings, a company can never really be sure exactly how many of its customers are still customers, or are “alive” (in CLV terminology). This requires the use of a predictive model to estimate how many customers from the past are still customers today.
The Beta Geometric Negative Binomial Distribution or BG/NBD model is one of the most common models used for this technique. The model is quite complex and hard to create from scratch, but there is an excellent implementation for R called Buy Til You Die or BTYD, and an equivalent Python package called Lifetimes, which also implements the same BG/NBD model.
For further information, check out my step-by-step guide to creating a non-contractual churn model.
 Picture by Rodnae.
What heuristics are used in place of retention?
Since many companies don’t really understand the customer retention metric, can’t measure individual customer activity accurately because customers aren’t tracked (such as most brick and mortar retail businesses), or don’t have data scientists on their teams to create the customer churn models required, they need an alternative approach.
It’s very common for companies to use heuristics aimed at providing a similar metric to retention rate that can be measured more easily. While the metrics may still often be inappropriately named “retention rate” internally, they are still often sufficient to give marketers a general steer on whether the company is increasing its actual average customer retention rate in the absence of the real value.
Common heuristics for those who can’t measure retention
| Metric | Description |
|---|---|
| Repeat purchase rate | Repeat purchase rate is a measure of the percentage of customers who have placed more than one order with the company, either for all time or within a recent period. It's potentially useful, but obviously gets skewed according to new customer acquisition activity. |
| Recency | The Recency (R) metric from the popular RFM model that examines Recency, Frequency, and Monetary value, can be useful in measuring how long it's been since customers last ordered. It might also give you a basic steer on customer behaviour, but again can be skewed by various things, including seasonality. |
| Frequency (F) | The Frequency (F) metric from the RFM model is another potential heuristic retailers can use. This looks at the number of orders customers have placed. |
| Latency | Customer latency is a metric that measures the gap between each of a customer's orders in days. This simple metric is actually used within more complex models, such as BG/NBD used for the calculation of Customer Lifetime Value. This model is based on the assumption that most customers typically order somewhere around the mean of their latency, so if a customer goes far beyond this figure, the probability of them still being a customer is much less than it would be if they'd ordered very recently. |
| Net Promoter Score (NPS) | Net Promoter Score (NPS) does not measure customer retention, but it is often linked to it. NPS is a one question survey that asks customers whether they would recommend the company to others and is scored from 1 to 10. People who rate the company 1-6 are called detractors; those who rate the company 7-8 are passives, and those who rate the company 9-10 are promoters. The passives are indifferent and are ignored. The final score lets you monitor customer satisfaction over time. If you scrape competitor reviews, you can even benchmark your NPS against theirs. |
| Customer Lifetime Value (CLV) | While I've added Customer Lifetime Value (CLV) here, it's equally challenging to calculate for those in non-contractual settings, so the chances of a business being able to measure it properly are, in my experience, pretty slim... That said, there are some excellent data science packages available to help you calculate Customer Lifetime Value that can be applied if you have a data scientist in the business. |
 Picture by Kampus.
Can cohort analysis help?
Cohort analysis can be a useful tool in helping to analyse how customer behaviour varies over time. It is particularly useful for retention studies that examine different marketing channels or marketing campaigns, since customers acquired via different channels often behave differently. However, you can apply it with many types of customer segmentation.
One interesting observation (and the topic of my Master’s degree research) is that deep discounting in particular can have a striking impact on the likelihood that customers will be retained. My research used cohort analysis to examine the behavioural differences of customers acquired via affiliate marketing websites via deep discounts.
Customers acquired using deep discounts behaved completely differently to those acquired via more conventional means. They were very expensive to acquire, didn’t come back unless they were given further deep discounts, and they spent far less than other customers, making the approach completely unprofitable.
How can you identify what drives customer churn?
In order to identify the factors influencing customer churn and could be improved to help increase retention, you first need to capture the right kind of data on your customers, typically via your CRM or customer help desk platform. You can also use Natural Language Processing (NLP) to examine customer support tickets or customer reviews in order to identify the drivers of churn using machine learning.
By identifying what influences retention rates the most, you can discover what you need to focus upon to improve your offering and improve the customer experience. You can also find out if the features of your retention strategy or loyalty programme actually work, or if you’re just rewarding customers needlessly or giving them things that don’t encourage them to stay customers.
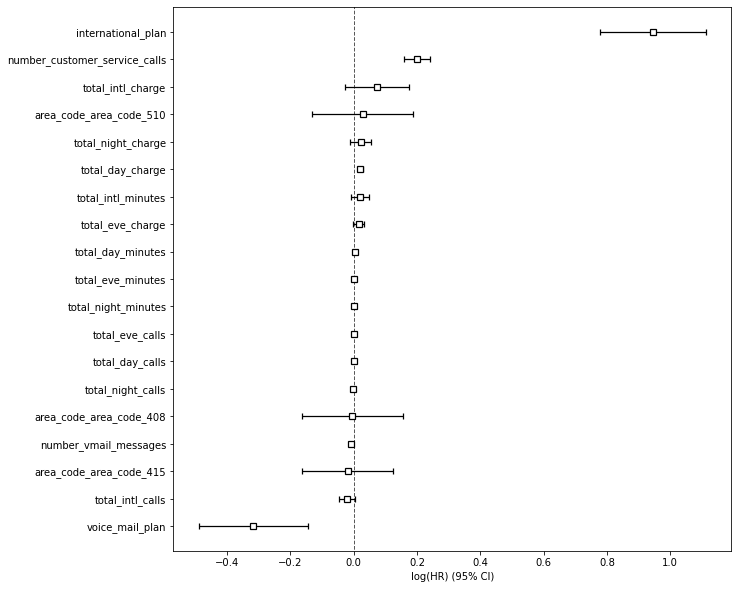
Cox’s Proportional Hazards model is one of the
best ways to analyse which factors influence customer retention and attrition the most. It can help
statistically pinpoint which aspects of the customer experience have the strongest positive effects on retention
and which ones are causing most of your attrition.
Importantly, a higher retention doesn’t always mean that customers are satisfied. There are other ways to increase retention without making customers happier. According to Aspinall et al. (2001), some customers may be apathetic and not bother to switch, while others may resent the company but be experiencing vendor lock-in, which makes the task of switching to a rival much harder. Similarly, customers that don’t appear to be loyal but themselves feel brand loyalty may be persuaded to purchase if barriers are removed.
Common factors influencing customer attrition
There are literally dozens of factors that can drive customer attrition. Here are some of the most common:
| Price increases | Customers often stop buying a product after you increase its price. This can often be hard to spot when you have thousands of products. It generally falls under the remit of your category manager, estimating team, or sales staff, depending on the business. |
| Courier failures | Customers often see courier failures, such as late or failed deliveries, as the fault of the retailer, not the courier, even when most ecommerce businesses in the UK rely upon the third-party courier network of delivery companies such as Yodel, TNT, and DPD. If couriers mess up, retailers need to apologise and sort out the problem, as it's them being judged not the courier. |
| Service failures | Late despatches, post-order stock outs, missing items, incorrect items, and damaged items, all impact the customer experience negatively. Companies should monitor who is being impacted by these and check what effects they have upon retention. Service recovery is often needed to stop them causing significant issues. |
| Barriers to switching | Barriers to switching are obstacles that make it more difficult for customers to defect to rival products or services. They're especially common in SaaS companies, where switching to a different cloud software platform may require the work of many staff over a lengthy period, and could introduce risk to the business. Companies with high barriers to switching include software providers, SaaS platforms, and web hosting companies, and they generally experience higher retention rates as a result. Generally, if the company has invested time and money in a system, they're going to be reluctant to switch quickly. |
| Onboarding | For SaaS companies or subscription-based app providers, onboarding is a critical step towards reducing attrition. If customers don't quickly get to grips with a product, or start getting value from its features, they're significantly more likely to defect or take up a full subscription at the end of a trial. SaaS companies will often introduce customer success teams to help in the onboarding process. |
| Returns experience | A smooth returns experience can also impact retention. If you have to jump through hoops to return an item, pay for delivery, or have it rejected for some insignificant reason, your likelihood to use the business again drops. On the other hand, if returns are free and easy, customers will feel more comfortable purchasing again. |
 Picture by Rodnae.
How can you increase your customer retention rate?
In order to improve your customer retention, you need to create a customer retention strategy. Larger companies sometimes create a dedicated customer success team that focuses specifically on improving customer retention.
A customer success team will work with data scientists to analyse the causes of churn, and will work to improve the offering to help keep customers happy and track metrics that allow them to monitor whether the techniques are working.
A step-by-step approach to improving retention
| 1. Collect data | Ensure your website, CRM, warehouse management system (WMS), and sales and customer service teams are capturing consistent high quality data on the factors that could influence churn. This step typically requires some cross-departmental collaboration and development support to ensure that everything you want to analyse is available. |
| 2. Perform a competitor analysis | While the data are being collected, undertake a detailed competitor analysis. Compare your offering within the market to your rivals. If you're an online retailer, for example, check that your delivery cut-offs are good, that you accept the right payment methods, that delivery is flexible and perceived as good value for money, and that your product range is complete and competitively priced. Scraping competitor reviews and analysing them with NLP can also be a worthwhile step. |
| 3. Identify what causes churn | Once you've collected enough data, use Cox's Proportional Hazards model or a similar technique to analyse which factors are most correlated with customer churn and which ones help retention. You might also want to try cohort analysis or survival analysis and examine behaviour across customer segments. |
| 4. Create a retention strategy | When you have identified what causes attrition and boosts retention you need to create a retention strategy to fix the issues and improve the customer experience so more customers stay. If you decide to implement a loyalty programme you should measure its effectiveness, since they often don't actually work. In my experience, the single best way to improve retention is to implement service recovery, apologise when issues go wrong, and ensure your customer service team respond to reviews on platforms such as Feefo and Trustpilot in a positive manner. |
| 5. Utilise retention marketing | Retention marketing is a specific subset of marketing that aims to decrease customer churn. While it can be complex, you can actually achieve pretty strong results using simple approaches like the RFM model and by measuring customer purchase latency. One of the things you'll definitely want to look at is encouraging customers to place a second order after they've placed their first. In ecommerce, customer base analysis often reveals that most customers have only ever placed a single order. |
| 6. Track retention metrics | Finally, you can't optimise what you can't measure, so you need to measure customer retention rate, or a heuristic metric if you don't have access to the churn model you'll need to calculate retention rate correctly. It may not matter that much what metric you use, providing it is actually correlated with the true retention rate. |
How can you identify customers about to churn?
Customer latency is perhaps the easiest metric you can use to identify which customers are most likely to churn. Customer latency (or purchase latency) measures the gap between each individual customer’s orders and is often analysed on its own as part of an order gap analysis.
The reason latency is so important is that customers typically purchase somewhere around the mean of their purchase latency. As the below graph shows, when the customer is placing orders within the mean period, their probability of being “alive” (in Customer Lifetime Value terms) remains high. However, as the customer latency gap gets bigger, they are much more likely to have lapsed as a customer, and are considered “at risk” of churning.
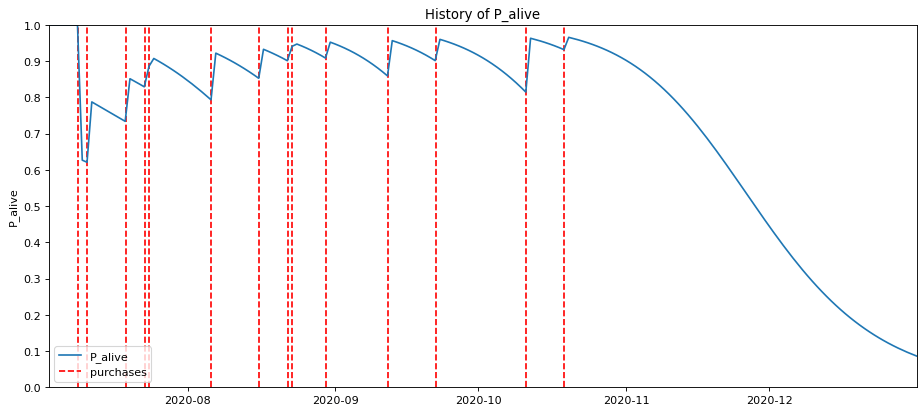
This time between orders is central to most Customer Lifetime Value models, such as the BG/NBD model and the Buy Til You Die implementation used by some data scientists. It’s easy to calculate purchase latency and the metric itself can be used to make simple estimates of whether a customer is due to order again soon or not. That in itself can be a useful tool for sales team in B2B ecommerce.
What is a good retention rate?
Since we know from the academic literature that most companies don’t know how to define or measure retention, and that most are likely to be using a crude heuristic, it’s difficult to state what “good” looks like, because the metrics they’re using aren’t directly comparable.
It will, of course, also vary for every sector and business, and it will be completely different in contractual settings compared to non-contractual settings, like retail.
My advice would be to define your retention metric internally, calculate and record it regularly and undertake analysis to understand what behaviours make customers leave. Keep making your products, prices, and service better so more customers stay and remain loyal.
Further reading
- Aspinall, E., Nancarrow, C. and Stone, M., 2001. The meaning and measurement of customer retention. Journal of Targeting, Measurement and Analysis for Marketing, 10(1), pp.79-87.
- Farris, P.W., Bendle, N., Pfeifer, P.E. and Reibstein, D., 2010. Marketing metrics: The definitive guide to measuring marketing performance. Pearson Education.
- Keiningham, T.L., Cooil, B., Aksoy, L., Andreassen, T.W. and Weiner, J., 2007. The value of different customer satisfaction and loyalty metrics in predicting customer retention, recommendation, and share‐of‐wallet. Managing service quality: An international Journal.
- Weinstein, A., 2002. Customer retention: A usage segmentation and customer value approach. Journal of Targeting, Measurement and analysis for Marketing, 10(3), pp.259-268.
Matt Clarke, Monday, November 01, 2021


Other posts you might like

How to use the Pandas truncate() function
Have you ever needed to chop the top or bottom off a Pandas dataframe, or extract a specific section from the middle? If so, there’s a Pandas function called truncate()...

How to use Spacy for noun phrase extraction
Noun phrase extraction is a Natural Language Processing technique that can be used to identify and extract noun phrases from text. Noun phrases are phrases that function grammatically as nouns...
