How to analyse ecommerce coupon uplift with GAPandas
Learn how to use GAPandas to measure ecommerce coupon uplift and optimise the AOV of your website via spend and save coupon codes.

In ecommerce, coupons, voucher codes, or discount codes are widely used for meeting a range of different sales objectives. They can encourage new customers to make their first purchase, encourage returning customers to order again and, when created strategically, they can also encourage all customers to spend more than they otherwise would.
These “spend and save” coupons typically offer a tiered discount that gets higher the more customers spend. For example, customers spending £50 might receive £5 off their order, customers spending £100 might get £10 off, and customers spending £150 might get £15 off.
When the thresholds are positioned correctly and placed just ahead of where customers would typically spend, they encourage customers to buy more items or buy more expensive items, which can increase the total revenue generated and, crucially, the average order value or AOV.
In this tutorial, I’ll explain how you can use some simple data science skills to measure the effectiveness of this type of coupon activity on an ecommerce website and use it to increase your site’s AOV. We’ll calculate a metric called coupon uplift which shows the amount that coupons add (or remove) from the site-wide AOV.
Setting thresholds for spend and save coupons
The critical step when creating a strategy for spend and save coupons on ecommerce websites is to position the thresholds or tiers correctly. To do this properly, I’d recommend using a discretization or data binning technique to group data instead of viewing the AOV as a single aggregate metric.
It’s fundamentally flawed to view AOV as a single value. Averages conceal hidden information and can be skewed by large orders and small orders, so you really do need to examine the distribution of order values in your data to truly understand what is happening and create the right coupon strategy to increase your AOV.
One of the best ways to optimise AOV is to use the Jenks natural breaks classification. This can show you where customers are currently spending, thus allowing you to spot where the thresholds need to go.
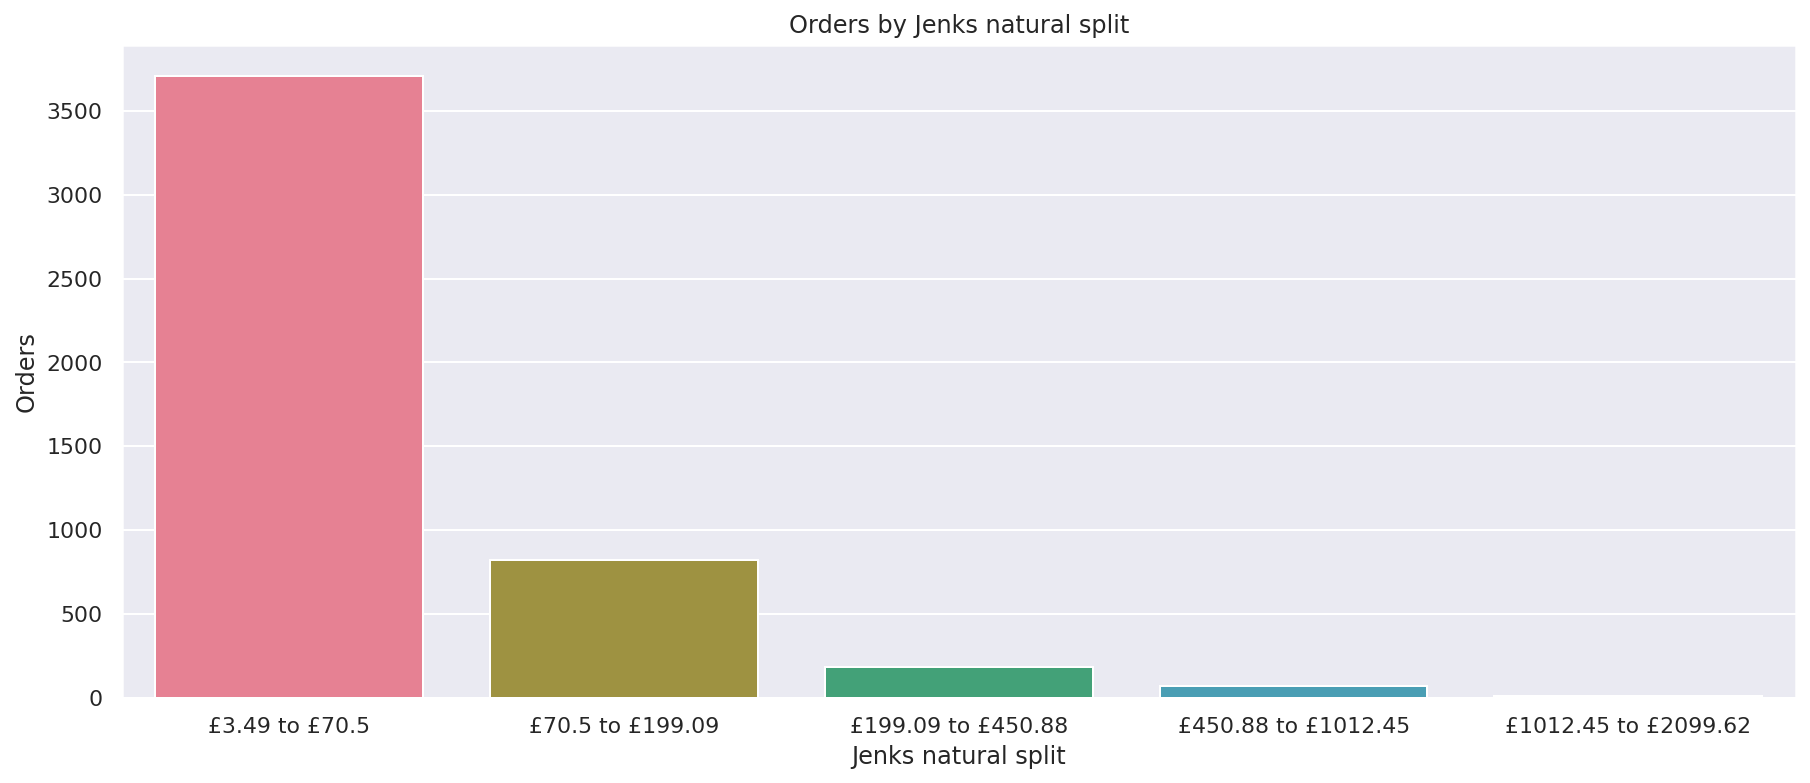
In the example above, the AOV we can see a clear break at £70, so there’s no point setting a coupon threshold below this if you want to increase AOV because the bulk of customers already spend that amount. Instead, if you set it at £80, you’ll encourage some of these customers to spend slightly more and offset the discount you’re knocking off.
You can repeat the process for other tiers, but you should be aware that a tiny percentage of customers might split their order if it’s more cost-effective for them to do so, and your coupon code setup rules allow multiple uses per customer.
Install the packages
For this tutorial, we’ll be querying data from a Google Analytics 3 or Universal Analytics account for an ecommerce website using GAPandas. The site is running Enhanced Ecommerce Tracking so includes additional data not present in a standard account. The GAPandas package can be used for Universal Analytics.
For Google Analytics 4, you could use my GAPandas4 package, but the steps for this will be different. Once installed, you’ll then need to import three packages for the project - Pandas, GAPandas, and Numpy.
!pip3 install --upgrade gapandas
import pandas as pd
import gapandas as gp
import numpy as np
Configure your Google Analytics API connection
Next, you’ll need to define some variables including the path to your JSON client secrets keyfile used for authenticating with the Google Analytics API, and define the view ID of the Google Analytics property you want to query, as well as the start date and end date for the period for which you want to extract data.
service = gp.get_service('client_secrets_november_2021.json')
view = '123456789'
start_date = '2021-07-01'
end_date = '2021-07-31'
Extract data on all orders
First, we’ll create an API payload that returns the number of transactions and revenue for the period grouped by the orderCouponCode used. For those orders where no coupon was used we’ll see a value of (not set). We’ll then use the GAPandas run_query() function to pass that query to the Google Analytics API and return a Pandas dataframe containing the initial results.
payload = {
    'start_date': start_date,
    'end_date': end_date,
    'metrics': 'ga:transactions, ga:transactionRevenue',
    'dimensions': 'ga:orderCouponCode',
    'sort': '-ga:transactions'
}

df = gp.run_query(service, view, payload)
df.head()
| orderCouponCode | transactions | transactionRevenue | |
|---|---|---|---|
| 0 | (not set) | 5267 | 181079.78 |
| 1 | COUPON1 | 387 | 37342.00 |
| 2 | COUPON2 | 186 | 12449.68 |
| 3 | COUPON3 | 101 | 3396.79 |
| 4 | COUPON4 | 45 | 1762.02 |
Calculate aggregate statistics for all orders
Next, we’ll create a Pandas dataframe of aggregate statistics. To tidy up any instances where users have entered coupon codes in mixed cases (which Google Analytics views as unique), we’ll use str.upper() to convert them all to upper case. We’ll then group the data by the orderCouponCode and calculate the sum of transactions and transactionRevenue for each coupon, effectively just tidying the previous dataframe.
df['orderCouponCode'] = df['orderCouponCode'].str.upper()
df = df.groupby('orderCouponCode').agg(
    transactions=('transactions', 'sum'),
    transactionRevenue=('transactionRevenue', 'sum'),
).sort_values(by='transactionRevenue', ascending=False).reset_index()
Once that’s created we’ll then calculate the average order value by dividing the number of transactions by the transactionRevenue, then calculate the percentage of total transactions and total revenue generated via each coupon code.
df['aov'] = df['transactionRevenue'] / df['transactions']
df['pc_of_transactions'] = (df['transactions'] /  df['transactions'].sum()) * 100
df['pc_of_revenue'] = (df['transactionRevenue'] /  df['transactionRevenue'].sum()) * 100
df.head()
| orderCouponCode | transactions | transactionRevenue | aov | pc_of_transactions | pc_of_revenue | |
|---|---|---|---|---|---|---|
| 0 | (NOT SET) | 5267 | 181079.78 | 34.380061 | 82.554859 | 68.212572 |
| 1 | COUPON1 | 387 | 37342.00 | 96.490956 | 6.065831 | 14.066694 |
| 2 | COUPON2 | 186 | 12449.68 | 66.933763 | 2.915361 | 4.689782 |
| 3 | COUPON3 | 34 | 5164.31 | 151.891471 | 0.532915 | 1.945390 |
| 4 | COUPON4 | 101 | 3396.79 | 33.631584 | 1.583072 | 1.279567 |
Calculate summary statistics for the period
In order to calculate the amount of uplift coupons generated for the site-wide AOV, we’ll need to calculate the overall performance based on all orders, whether they included coupons or not. We can do this by summing the columns and then calculating the AOV.
revenue = int(df['transactionRevenue'].sum())
transactions = df['transactions'].sum()
aov = round(revenue / transactions, 2)
Next, we’ll calculate the statistics for non-coupon orders which will have a (not set) value in the Google Analytics orderCouponCode data. We can calculate this by filtering the dataframe for orderCouponCode values that are set to (NOT SET) (since we converted this to uppercase earlier), and then repeat the calculations used above.
revenue_non_coupon = int(df[df['orderCouponCode']=='(NOT SET)']['transactionRevenue'].sum())
transactions_non_coupon = df[df['orderCouponCode']=='(NOT SET)']['transactions'].sum()
aov_non_coupon = round(revenue_non_coupon / transactions_non_coupon, 2)
Finally, we can do the same process for orders that include coupons, which will not have a value of (NOT SET). Once that’s done, we’ll have three sets of aggregate metrics for all orders, orders with coupons, and orders without coupons.
revenue_coupon = int(df[df['orderCouponCode']!='(NOT SET)']['transactionRevenue'].sum())
transactions_coupon = df[df['orderCouponCode']!='(NOT SET)']['transactions'].sum()
aov_coupon = round(revenue_coupon / transactions_coupon, 2)
If we examine these aggregate statistics we can see that the site had an AOV of £41.61 for all orders. Orders without coupons had an AOV of £34.38, but orders with coupons had an AOV of £75.82. Therefore, we can clearly see that the larger AOV of those coupon orders is increasing the site AOV since it’s significantly higher.
print("Transactions: ", transactions)
print("Revenue: £", revenue)
print("AOV: £", aov)
Transactions:  6380
Revenue: £ 265463
AOV: £ 41.61
print("Transactions (non-coupon): ", transactions_non_coupon)
print("Revenue (non-coupon): £", revenue_non_coupon)
print("AOV (non-coupon): £", aov_non_coupon)
Transactions (non-coupon):  5267
Revenue (non-coupon): £ 181079
AOV (non-coupon): £ 34.38
print("Transactions (coupon): ", transactions_coupon)
print("Revenue (coupon): £", revenue_coupon)
print("AOV (coupon): £", aov_coupon)
Transactions (coupon):  1113
Revenue (coupon): £ 84384
AOV (coupon): £ 75.82
Calculate coupon uplift
Finally, we’ll calculate the coupon uplift. Firstly, we’ll calculate the expected revenue from coupon orders. If the coupons have no impact upon AOV then we’d expect the total revenue they generate to be the same as the number of coupon transactions multiplied by the non-coupon AOV.
If the expected revenue is higher, then the coupon activity is increasing AOV, and if it’s lower, then it’s decreasing AOV. Similarly, we can measure the total uplift from coupons by subtracting the expected revenue from coupons from the actual revenue from coupons.
expected_revenue = transactions_coupon * aov_non_coupon
total_uplift = revenue_coupon - expected_revenue
For the site examined, the expected coupon revenue was £38,264, but the site actually generated £84,384, thus providing £46,199 in total uplift. That’s really good and shows that the coupons used on this site are having a very positive effect on pushing customers to spend more.
print("Expected revenue:", expected_revenue)
print("Total uplift:", total_uplift)
Expected revenue: 38264.94
Total uplift: 46119.06
Finally, we can calculate the coupon uplift per order using the formula (revenue_coupon - (transactions_coupon * aov_non_coupon)) / transactions. This shows us that the coupon activity on the site is adding an extra £7.22 to the site-wide AOV, which is quite impressive.
uplift_per_order = (revenue_coupon - (transactions_coupon * aov_non_coupon)) / transactions
print("Coupon uplift per order:", uplift_per_order)
Coupon uplift per order: 7.228692789968652
Coupons can, of course, be used for more than simply boosting your AOV. They also have an important objective of boosting conversion rate too, because they encourage customers to place an order that they otherwise may not have placed.
Therefore, while coupon uplift is a great way to check that your ecommerce coupon activity is helping your AOV and not causing it to go down, you do also need to consider wider coupon usage activity, so I’d highly recommend monitoring the percentage of orders placed with coupons and settling on a strategy that works for your ecommerce business.
Matt Clarke, Tuesday, July 19, 2022


Other posts you might like

How to use the Pandas truncate() function
Have you ever needed to chop the top or bottom off a Pandas dataframe, or extract a specific section from the middle? If so, there’s a Pandas function called truncate()...

How to use Spacy for noun phrase extraction
Noun phrase extraction is a Natural Language Processing technique that can be used to identify and extract noun phrases from text. Noun phrases are phrases that function grammatically as nouns...
