How to detect Google Search Console anomalies
Learn how to use Python to export data from the Google Search Console API using Python and construct simple anomaly detection models to identify issues.

There are some great anomaly detection models available for Python, which let you examine complex data for a wide range of different anomaly types. In this project, I’ll show you how you can export your data from the Google Search Console API using Python and create some anomaly detection models to pinpoint potential anomalous changes.
Load the packages
We’ll be using Pandas for general data manipulation, the Google API client and OAuth2 library for connecting to the Google Search Console API, and the Anomaly Detection Toolkit (ADTK) for building our anomaly detection models. Open a Jupyter notebook and import the packages.
import requests
import json
import pandas as pd
from google.oauth2 import service_account
from googleapiclient.discovery import build
from adtk.data import validate_series
from adtk.visualization import plot
from adtk.detector import PersistAD
Connect to the Google Search Console API
I’ll assume you have already created a Google Search Console API client secrets JSON key set up and know how to query the API using Python, but check out my guide to using Google Search Console with Python if you need help getting started.
To connect to the API, I’ve created a function called connect() which passes the file path for your JSON key to Google Search Console and returns an authenticated service object that we can use to run queries on our data.
def connect(key):
    """Create a connection to the Google Search Console API and return service object.

    Args:
        key (string): Google Search Console JSON client secrets path.

    Returns:
        service (object): Google Search Console service object.
    """

    scope = ['https://www.googleapis.com/auth/webmasters']
    credentials = service_account.Credentials.from_service_account_file(key,
                                                                        scopes=scope)
    service = build(
        'webmasters',
        'v3',
        credentials=credentials
    )

    return service
key = 'google-search-console.json'
service = connect(key)
Fetch your Google Search Console data
Next, we’ll create a function called query() which takes the service object from connect(), and passes that to Google Search Console along with the site_url defining the property you want to query, and a payload dictionary containing your GSC API search query. This returns the result in a Pandas dataframe so we can manipulate the data more easily.
def query(service, site_url, payload):
    """Run a query on the Google Search Console API and return a dataframe of results.

    Args:
        service (object): Service object from connect()
        site_url (string): URL of Google Search Console property
        payload (dict): API query payload dictionary

    Return:
        df (dataframe): Pandas dataframe containing requested data.

    """

    response = service.searchanalytics().query(siteUrl=site_url, body=payload).execute()

    results = []

    for row in response['rows']:
        data = {}

        for i in range(len(payload['dimensions'])):
            data[payload['dimensions'][i]] = row['keys'][i]

        data['clicks'] = row['clicks']
        data['impressions'] = row['impressions']
        data['ctr'] = round(row['ctr'] * 100, 2)
        data['position'] = round(row['position'], 2)
        results.append(data)

    return pd.DataFrame.from_dict(results)
You can create any query you like in order to examine the presence of potential anomalies. To keep things simple, I’ve selected all the site traffic to my website for 2020 and have set the date dimension without specifying any filters. You can, of course, drill down your search to cover absolutely anything, providing you include a date in the dimension column.
payload = {
    'startDate': "2020-01-01",
    'endDate': "2020-12-31",
    'dimensions': ["date"],
    'rowLimit': 25000,
    'startRow': 0
}

site_url = "http://flyandlure.org"

df = query(service, site_url, payload)
df.head()
| date | clicks | impressions | ctr | position | |
|---|---|---|---|---|---|
| 0 | 2020-01-01 | 333 | 7599 | 4.38 | 15.14 |
| 1 | 2020-01-02 | 360 | 8723 | 4.13 | 14.91 |
| 2 | 2020-01-03 | 374 | 8497 | 4.40 | 15.74 |
| 3 | 2020-01-04 | 308 | 8188 | 3.76 | 16.24 |
| 4 | 2020-01-05 | 365 | 7861 | 4.64 | 15.87 |
Prepare your data for modeling
Since anomalies are time series based data, the first step you need to undertake is to check the data types in your dataframe of results from Google Search Console, which you can see using df.info(). This reveals that the date column is currently set to the object data type.
df.info()
<class 'pandas.core.frame.DataFrame'>
RangeIndex: 366 entries, 0 to 365
Data columns (total 5 columns):
 #   Column       Non-Null Count  Dtype
---  ------       --------------  -----
 0   date         366 non-null    object
 1   clicks       366 non-null    int64
 2   impressions  366 non-null    int64
 3   ctr          366 non-null    float64
 4   position     366 non-null    float64
dtypes: float64(2), int64(2), object(1)
memory usage: 14.4+ KB
The anomaly detection model requires that the date is a datetime format, so we’ll pass the column to to_datetime() and reassign the value back to the same column. We also need this to be our dataframe’s index, so we’ll use set_index() to set correct this.
df['date'] = pd.to_datetime(df['date'])
df = df.set_index('date')
Create your anomaly detection model
The Anomaly Detection Toolkit includes a wide range of different types of anomaly detection model, since there are many types of anomaly. For a detailed guide to ADTK, you might find it useful to check out my post on How to create ecommerce anomaly detection models.
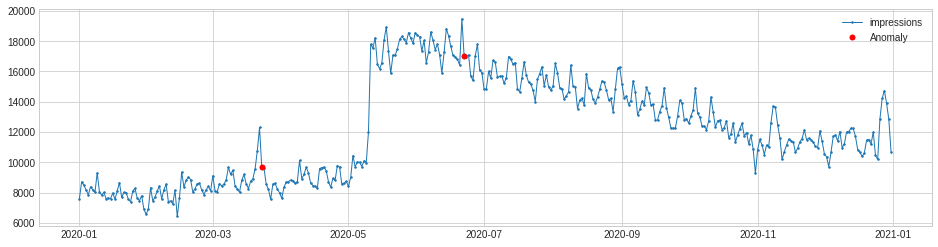
To start off, we’ll select the impressions column from our dataframe and use validate_series() to prepare this for use in the model. Then, we’ll create a Persist Anomaly Detection model to detect only positive anomalies, where impressions have increased.
s = validate_series(df['impressions'])

persist_ad = PersistAD(c=2, side='positive')
anomalies = persist_ad.fit_detect(s)

chart = plot(s,
     anomaly=anomalies,
     ts_linewidth=1,
     ts_markersize=3,
     anomaly_markersize=5,
     anomaly_color='red',
     anomaly_tag='marker')
By using the plot() function and setting the anomalies to appear as red markers, we can see clearly where our anomalous increases in impressions occurred. The “level shift” anomaly in early May coincided with the May 5th Core Update Algorithm change, which saw my site traffic (and ad revenue) increase significantly. As the site traffic is seasonal, this eventually tailed off.

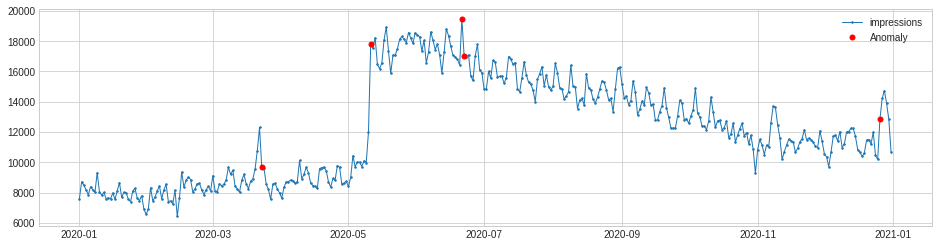
Besides just looking at the positive anomalies, we can also see the negative ones, by changing the value we pass to the side parameter when configuring the PersistAD() model. Thankfully, there weren’t many drops in impressions, and when they did arise they were linked to spikes that happened previously.
s = validate_series(df['impressions'])

persist_ad = PersistAD(c=2, side='negative')
anomalies = persist_ad.fit_detect(s)

chart = plot(s,
     anomaly=anomalies,
     ts_linewidth=1,
     ts_markersize=3,
     anomaly_markersize=5,
     anomaly_color='red',
     anomaly_tag='marker')
If you want to see anomalies on both the positive and negative side, you can use the both argument. This merges all the positive and negative anomalies in a single plot.
s = validate_series(df['impressions'])

persist_ad = PersistAD(c=2, side='both')
anomalies = persist_ad.fit_detect(s)

chart = plot(s,
     anomaly=anomalies,
     ts_linewidth=1,
     ts_markersize=3,
     anomaly_markersize=5,
     anomaly_color='red',
     anomaly_tag='marker')
Examine anomalies in other metrics
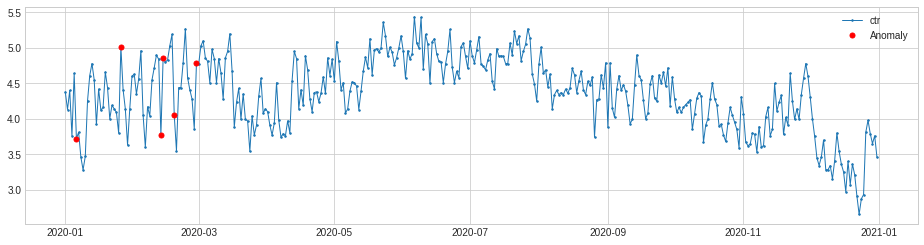
Next, let’s take a look at some other metrics in Google Search Console to see if anything anomalous has occurred within the data. Click through rate showed a few anomalies early in the year, but then dropped off, presumably due to seasonal interest and Christmas.
s = validate_series(df['ctr'])

persist_ad = PersistAD(c=2, side='both')
anomalies = persist_ad.fit_detect(s)

chart = plot(s,
     anomaly=anomalies,
     ts_linewidth=1,
     ts_markersize=3,
     anomaly_markersize=5,
     anomaly_color='red',
     anomaly_tag='marker')
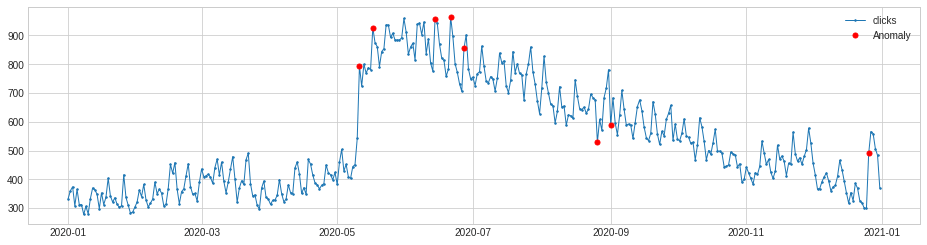
Clicks, however, show more anomalies, which are tied to the impressions data above. This is great, because it means that the site not only appeared more often in the SERPs, but we also generated many more clicks. Looks like people were also clicking more often than usual over Christmas, too.
s = validate_series(df['clicks'])

persist_ad = PersistAD(c=2, side='both')
anomalies = persist_ad.fit_detect(s)

chart = plot(s,
     anomaly=anomalies,
     ts_linewidth=1,
     ts_markersize=3,
     anomaly_markersize=5,
     anomaly_color='red',
     anomaly_tag='marker')
There’s loads more you can do with the Anomaly Detection Toolkit. With some ingenuity, you could even set up automated reports to look for potential anomalies in specific search terms of interest and alert you via email or Slack. Check out my ADTK guide for more information on creating models to detect specific types of anomaly.
Matt Clarke, Friday, August 13, 2021


Other posts you might like

How to use the Pandas truncate() function
Have you ever needed to chop the top or bottom off a Pandas dataframe, or extract a specific section from the middle? If so, there’s a Pandas function called truncate()...

How to use Spacy for noun phrase extraction
Noun phrase extraction is a Natural Language Processing technique that can be used to identify and extract noun phrases from text. Noun phrases are phrases that function grammatically as nouns...
