How to geocode and map addresses using GeoPy
Learn how to use GeoPy, Nominatim, and Folium to geocode and plot Pizza Express branches in the vicinity of Buckingham Palace, without breaking a sweat.

In the field sales sector, one common thing you’ll want to do is identify all the potential clients you have within a particular region, so you can assign your team the task of visiting them. Recent advances in geocoding technology, and open APIs such as the Nominatim project from OpenStreetMap make this much easier.
In this example, we’ll take a Pandas dataframe of addresses of Pizza Express branches, geocode them to obtain their latitude and longitude using Nominatim, calculate their distance from our starting point at Buckingham Palace London using GeoPy, and then map them using Folium. Here’s how it’s done.
Load the packages
Open a Jupyter notebook and import the pandas, folium package, plus the Nominatim module from the geopy package. Any packages you don’t have can be installed by entering pip3 install package-name into your terminal.
import pandas as pd
from geopy.geocoders import Nominatim
import folium
Configure Nominatim
Next, create a geolocator object using Nominatim. This gives you access to the API that powers the OpenStreetMap (OSM) mapping project and will allow us to geocode the addresses to obtain their latitude and longitude coordinates. When connecting, you’ll need to define a timeout, and pass in a user_agent string.
geolocator = Nominatim(timeout=10, user_agent="PDS")
Load your data
You can use any address dataset you like. For demonstration purposes, I’ve constructed a really simple dataset comprising the postcodes of a range of Pizza Express restaurants in London and the surrounding area. You can pass in partial addresses, such as postcodes, or complete addresses, but you may need to experiment to get the best match results.
df = pd.read_csv('pizza.csv')
df.head()
| postcode | |
|---|---|
| 0 | EC2Y 5AS |
| 1 | WC2R 1JA |
| 2 | W2 1BF |
| 3 | SE1 9QQ |
| 4 | SW15 2SW |
Geocode an address
Next, we’ll use the geocode() function from geolocator. I’ve given this the address of Buckingham Palace, London, which has the postcode SW1 1AA. Running the function returns some data from geolocator, comprising the full address, the latitude and longitude coordinates.
location = geolocator.geocode('Buckingham Palace, London, SW1 1AA')
location
Location(Buckingham Palace, Buckingham Gate, Victoria,
City of Westminster, London, Greater London, England,
SW1E 6JP, United Kingdom, (51.500841300000005, -0.14298782562962786, 0.0))
Geocode all of the addresses
Now we know how to geocode a single address, we can apply the same technique to geocode each of the postcodes in our dataframe. All we need to do is pass geolocator.geocode to the apply() function and assign the output shown above to a new column.
df['geocode'] = df['postcode'].apply(geolocator.geocode)
df.head(10)
| postcode | geocode | |
|---|---|---|
| 0 | EC2Y 5AS | (City of London, Greater London, England, EC2Y... |
| 1 | WC2R 1JA | (City of Westminster, London, Greater London, ... |
| 2 | W2 1BF | (City of Westminster, London, Greater London, ... |
| 3 | SE1 9QQ | (London Borough of Southwark, London, Greater ... |
| 4 | SW15 2SW | (London Borough of Wandsworth, London, Greater... |
| 5 | EC2M 4QD | (City of London, Greater London, England, EC2M... |
| 6 | SE10 9BG | (Royal Borough of Greenwich, London, Greater L... |
| 7 | W5 5AS | (London Borough of Ealing, London, Greater Lon... |
| 8 | GU21 6LJ | (Woking, Surrey, South East, England, GU21 6LJ... |
| 9 | KT11 2JZ | (Cobham, Surrey, South East, England, KT11 2JZ... |
df['geocode']
0     (City of London, Greater London, England, EC2Y...
1     (City of Westminster, London, Greater London, ...
2     (City of Westminster, London, Greater London, ...
3     (London Borough of Southwark, London, Greater ...
4     (London Borough of Wandsworth, London, Greater...
5     (City of London, Greater London, England, EC2M...
6     (Royal Borough of Greenwich, London, Greater L...
7     (London Borough of Ealing, London, Greater Lon...
8     (Woking, Surrey, South East, England, GU21 6LJ...
9     (Cobham, Surrey, South East, England, KT11 2JZ...
10    (Elmbridge, Surrey, South East, England, KT11 ...
Name: geocode, dtype: object
Extract the latitude and longitude coordinates
To extract the latitude and longitude data from the geocode column we can loop over the content and assign the output to a new column. This gives us the coordinates for each of the postcodes in our dataframe.
df['latitude'] = [g.latitude for g in df.geocode]
df['longitude'] = [g.longitude for g in df.geocode]
df.head()
| postcode | geocode | latitude | longitude | |
|---|---|---|---|---|
| 0 | EC2Y 5AS | (City of London, Greater London, England, EC2Y... | 51.517468 | -0.093806 |
| 1 | WC2R 1JA | (City of Westminster, London, Greater London, ... | 51.511669 | -0.117540 |
| 2 | W2 1BF | (City of Westminster, London, Greater London, ... | 51.519118 | -0.171811 |
| 3 | SE1 9QQ | (London Borough of Southwark, London, Greater ... | 51.506266 | -0.088671 |
| 4 | SW15 2SW | (London Borough of Wandsworth, London, Greater... | 51.460126 | -0.213197 |
Calculating distances using GeoPy
Besides the excellent Nominatim package, GeoPy also includes a module for calculating the distance between two sets of latitude and longitude coordinates. There are actually several ways to calculate distances, but the most widely used is the geodesic distance.
To calculate the geodesic distance we first need to import the geodesic package from geopy.distance, and then define our start latitude and longitude, which I’ve set to the coordinates for Buckingham Palace, London.
from geopy.distance import geodesic
start_latitude = 51.500841300000005
start_longitude = -0.14298782562962786
Next, we can use apply() and a lambda function to run the geodesic() function and pass in two tuples - one containing the start coordinates, and one containing the coordinates for the current row in our dataframe. By appending the .miles value we can calculate the distance of each Pizza Express branch from Buckingham Palace.
df['distance'] = df.apply(lambda x:
                          geodesic((start_latitude, start_longitude),\
                                   (x.latitude, x.longitude)).miles, axis=1)
df.sort_values(by='distance', ascending=True)
| postcode | geocode | latitude | longitude | distance | |
|---|---|---|---|---|---|
| 1 | WC2R 1JA | (City of Westminster, London, Greater London, ... | 51.511669 | -0.117540 | 1.328790 |
| 2 | W2 1BF | (City of Westminster, London, Greater London, ... | 51.519118 | -0.171811 | 1.772739 |
| 3 | SE1 9QQ | (London Borough of Southwark, London, Greater ... | 51.506266 | -0.088671 | 2.373324 |
| 0 | EC2Y 5AS | (City of London, Greater London, England, EC2Y... | 51.517468 | -0.093806 | 2.413051 |
| 5 | EC2M 4QD | (City of London, Greater London, England, EC2M... | 51.518588 | -0.079283 | 3.009614 |
| 4 | SW15 2SW | (London Borough of Wandsworth, London, Greater... | 51.460126 | -0.213197 | 4.136189 |
| 6 | SE10 9BG | (Royal Borough of Greenwich, London, Greater L... | 51.480555 | -0.008996 | 5.950335 |
| 7 | W5 5AS | (London Borough of Ealing, London, Greater Lon... | 51.511856 | -0.305624 | 7.057708 |
| 9 | KT11 2JZ | (Cobham, Surrey, South East, England, KT11 2JZ... | 51.329381 | -0.410783 | 16.568432 |
| 10 | KT11 3DB | (Elmbridge, Surrey, South East, England, KT11 ... | 51.304288 | -0.405450 | 17.703976 |
| 8 | GU21 6LJ | (Woking, Surrey, South East, England, GU21 6LJ... | 51.317423 | -0.564939 | 22.216523 |
Map the addresses using Folium
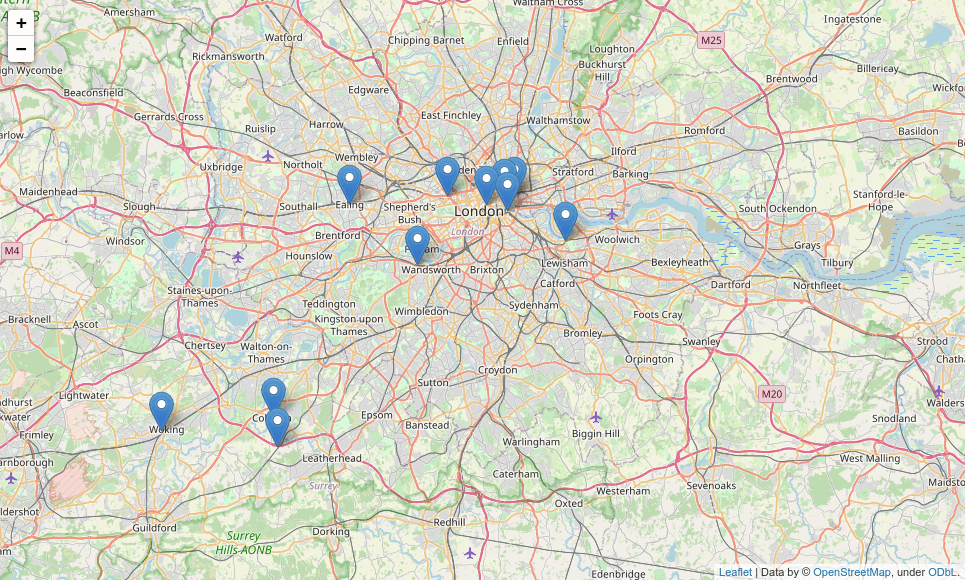
Finally, we can create a map and plot our addresses. I’ve centered my map on the latitude and longitude of Buckingham Palace, then I’ve looped over the dataframe and extracted the latitude, longitude and postcode for each pizza restaurant and placed a pin in the map at that location. This gives us a whole load of pizza restaurants we can visit.
pizza_map = folium.Map(location=(51.500841300000005, -0.14298782562962786), zoom_start=10)
for index,row in df.iterrows():
  folium.Marker(location=(row['latitude'],
                          row['longitude']),
                popup=row['postcode']).add_to(pizza_map)

display(pizza_map)
Matt Clarke, Thursday, March 11, 2021


Other posts you might like

How to use the Pandas truncate() function
Have you ever needed to chop the top or bottom off a Pandas dataframe, or extract a specific section from the middle? If so, there’s a Pandas function called truncate()...

How to use Spacy for noun phrase extraction
Noun phrase extraction is a Natural Language Processing technique that can be used to identify and extract noun phrases from text. Noun phrases are phrases that function grammatically as nouns...
