How to use NLP to identify what drives customer satisfaction
Learn how to use web scraping and NLP to shape your ecommerce strategy by identifying what influences customer satisfaction within your market.

While some people might naively interpret it as negativity, I think one of the best ways you can improve an ecommerce business is to focus on the stuff you’re not doing well. After all, ecommerce is a numbers game in which growth comes from spotting things that are broken and then fixing them to generate extra profits.
Negative feedback on your business, whether it’s from your customers, potential customers, or your staff, can yield the vital clues you need to help you shape your offering so it meets (or exceeds) customer expectations, increasing the probability that customers will remember how good you were and come back.
Focusing on the “negative” things is something managers should encourage. The ability to constructively critique your ecommerce business and fix the things that annoy customers is what will help your team grow your profits. This is handy for me, because I both work in ecommerce and have a neurological predisposition towards analytical cynicism that could easily land me a lucrative second career as a world class de-motivational speaker.
One really useful way to obtain this valuable constructive insight, and that vital list of broken things to fix, is through scraping the service reviews of the businesses in your sector and using Natural Language Processing to understand, statistically and objectively, what customers like and dislike. With a bit of effort, and some technical creativity, you can create a business-specific dataset that contains valuable information about the drivers of customer satisfaction in your market. Here’s how it’s done.
1. Scrape your competitors’ reviews
While you could just look at your own reviews and skip the scraping step altogether, you’ll learn a lot more about the trends in your market if you analyse the reviews of your competitors alongside your own data. There are many excellent packages available which make it possible to create custom scrapers - Scrapy, Selenium, and Beautiful Soup are all excellent tools for this purpose.
The scraper I wrote below uses Selenium to scrape TrustPilot reviews from a range of businesses selling Land Rover Defender supplies in the UK, and then uses Extruct to extract and parse the JSON-LD schema.org review markup in the page. It returns a Pandas dataframe containing thousands of reviews and ratings from each of the businesses, which can give us a great insight into customer expectations in this niche ecommerce market.
import pandas as pd
import extruct as ex
from selenium import webdriver
from selenium.webdriver.chrome.options import Options

urls = [
    'https://uk.trustpilot.com/review/www.mudstuff.co.uk',
    'https://uk.trustpilot.com/review/landroverdefendersecurity.com',
    'https://uk.trustpilot.com/review/famousfour.co.uk',
    'https://uk.trustpilot.com/review/www.bearmach.com',
    'https://uk.trustpilot.com/review/lrparts.net',
    'https://uk.trustpilot.com/review/www.johncraddockltd.co.uk',
    'https://uk.trustpilot.com/review/www.paddockspares.com',
]

def get_driver():
    options = Options()
    options.add_argument('--headless')
    driver = webdriver.Chrome(options=options)
    return driver


def get_source(driver, url):
    driver.get(url)
    return driver.page_source


def get_json(source):
    return ex.extract(source, syntaxes=['json-ld'])


def get_next_page(driver, source):
    elements = driver.find_elements_by_xpath('//link[@rel="next"]')
    if elements:
        return driver.find_element_by_xpath('//link[@rel="next"]').get_attribute('href')
    else:
        return ''


def save_reviews(data, df):
    for item in data['json-ld']:
        if "review" in item:
            for review in item['review']:

                row = {
                    'author': review.get('author', {}).get('name'),
                    'headline': review.get('headline'),
                    'body': review.get('reviewBody'),
                    'rating': review.get('reviewRating', {}).get('ratingValue'),
                    'item_reviewed': review.get('itemReviewed', {}).get('name'),
                    'publisher': review.get('publisher', {}).get('name'),
                    'date_published': review.get('datePublished')
                }

                df = df.append(row, ignore_index=True)

    return df

df = pd.DataFrame(columns = ['author', 'headline', 'body', 'rating',
                             'item_reviewed', 'publisher', 'date_published'])

for url in urls:

    print(url)

    # Save the reviews from the first page
    driver = get_driver()
    source = get_source(driver, url)
    json = get_json(source)
    df = save_reviews(json, df)

    # Get reviews on each paginated page
    next_page = get_next_page(driver, source)
    paginated_urls = []
    paginated_urls.append(next_page)

    if paginated_urls:

        for url in paginated_urls:

            if url:

                print(next_page)
                driver = get_driver()
                source = get_source(driver, url)
                json = get_json(source)
                df = save_reviews(json, df)
                next_page = get_next_page(driver, source)
                paginated_urls.append(next_page)

df.to_csv('land_rover_reviews.csv')
df.head(1000)
| headline | body | rating | item_reviewed | publisher | date_published | |
|---|---|---|---|---|---|---|
| 0 | Great products and service | If only all companies were as good as Mud UK. ... | 5 | MUD-UK | Trustpilot | 2020-07-27T17:26:08Z |
| 1 | Ordered a few bits from the website… | Ordered a few bits from the website which came... | 5 | MUD-UK | Trustpilot | 2019-10-21T18:46:38Z |
| 2 | Absolutely stellar customer service | Always very swift at shipping the orders. Got ... | 5 | MUD-UK | Trustpilot | 2017-02-10T13:04:42Z |
| 3 | Great customer service | When I called to discuss my potential order th... | 5 | LRD Security | Trustpilot | 2020-03-19T20:00:52Z |
| 4 | Happy customer | Promt and professional service | 5 | LRD Security | Trustpilot | 2020-03-19T16:25:34Z |
| ... | ... | ... | ... | ... | ... | ... |
| 995 | Easy to deal with and very quick | Easy to deal with and very quick delivery (3 d... | 5 | Famous Four | Trustpilot | 2018-05-08T20:01:02Z |
| 996 | Everything I need !! | Everything I need !! | 5 | Famous Four | Trustpilot | 2018-05-08T17:17:43Z |
| 997 | brilliant service couldnt ask for better | brilliant service couldnt ask for better | 5 | Famous Four | Trustpilot | 2018-05-08T16:33:29Z |
| 998 | Fast and reliable | Fast and reliable | 5 | Famous Four | Trustpilot | 2018-05-08T15:47:23Z |
| 999 | saudi shipping Excellent with DHL | saudi shipping Excellent with DHL | 5 | Famous Four | Trustpilot | 2018-05-08T14:21:28Z |
2. Identify review sentiment
To analyse the things that customers like and dislike you need a simple way of differentiating a positive review from a negative one. I’ve previously shown how you can do this on text by creating a sentiment analysis model using a Long Short-Term Memory recurrent neural network in TensorFlow. Several HuggingFace Transformers models also give superb results for text-based sentiment analysis. However, as we have the star ratings in this data set it’s not required here.
In fact, since we have star ratings, there’s arguably little need to engineer any additional sentiment-related features. All you really need to know is whether the text from a given review was positive or negative, and you can see that from the star rating the customer has given. However, when communicating metrics relating to customer satisfaction, it can be useful to refer to the Net Promoter Score, which you can infer from each review’s star rating. It can also help when analysing and interpreting the data and when presenting your findings to stakeholders.
Net Promoter Score has become the standard metric for measuring customer satisfaction and, while you could argue
that the concept has its flaws, it’s undeniably quite useful in ecommerce. NPS is calculated by subtracting the percentage of “detractors” (people who rate you 0-6 out of 10) from the percentage of “promoters” (people who rate you 9 or 10) - ignoring any “passives” (who rated you 7 or 8). You can infer an approximation of the NPS from the star rating awarded using Numpy and Pandas. We’ll use np.where() and assign a one-hot encoding or binary value to the detractor, passive, or promoter data.
import pandas as pd
import numpy as np

df = pd.read_csv('land_rover_reviews.csv')

df['detractor'] = np.where(df['rating'] < 4, 1, 0)
df['passive'] = np.where(df['rating'] == 4, 1, 0)
df['promoter'] = np.where(df['rating'] == 5, 1, 0)

df[['headline', 'rating', 'detractor', 'passive', 'promoter']].sample(5)
| headline | rating | detractor | passive | promoter | |
|---|---|---|---|---|---|
| 3137 | the item arrived on time. | 4 | 0 | 1 | 0 |
| 19482 | My opinion of paddock site | 5 | 0 | 0 | 1 |
| 11938 | Easy ordering, good and friendly service | 5 | 0 | 0 | 1 |
| 14481 | Everything you want from a company | 5 | 0 | 0 | 1 |
| 17585 | excellant | 5 | 0 | 0 | 1 |
3. Pre-process the data
Now we have our raw data, we need to apply Natural Language Processing techniques to analyse it. Before doing any NLP work, it’s sensible to apply some basic pre-processing to your data to ensure it’s clean, tidy, and uniform.
First, we’ll concatenate the headline and body columns of the Pandas dataframe into a single column called text. Then we’ll convert the text to lowercase using lower() and use a Python regular expression to remove any punctuation or other characters.
df['text'] = df['headline'] + ' ' + df['body']
df['text'] = df['text'].str.lower()
df['text'] = df['text'].str.replace('[^\w\s]','')
Next, we’ll split off the columns we need for the analysis and use the detractor, passive, and promoter values to create three dataframes for each kind of sentiment we want to analyse.
df = df[['item_reviewed', 'text', 'detractor', 'passive', 'promoter']]

df_detractor = df[df['detractor']==1]
df_passive = df[df['passive']==1]
df_promoter = df[df['promoter']==1]
4. N-gram analysis
There are lots of different techniques you can use to analyse text using NLP. First, we’ll apply a technique called N-gram analysis. This finds groups of co-occurring words, called “n-grams”, based on their frequency in the text.
We’ll apply this using the CountVectorizer model in scikit-learn’s feature_extraction.text module and we’ll look at “bigrams” (two co-occuring words) and “trigrams” (three co-occurring words) across the df_detractors, df_passives, and df_promoters dataframes.
from sklearn.feature_extraction.text import CountVectorizer

def get_bigrams(descriptions, n=None):

    vec = CountVectorizer(ngram_range = (2,2), max_features = 20000).fit(descriptions)
    bag_of_words = vec.transform(descriptions)
    sum_words = bag_of_words.sum(axis = 0)
    words_freq = [(word, sum_words[0, i]) for word, i in vec.vocabulary_.items()]
    words_freq =sorted(words_freq, key = lambda x: x[1], reverse = True)

    return words_freq[:n]

def get_trigrams(descriptions, n=None):

    vec = CountVectorizer(ngram_range = (3,3), max_features = 20000).fit(descriptions)
    bag_of_words = vec.transform(descriptions)
    sum_words = bag_of_words.sum(axis = 0)
    words_freq = [(word, sum_words[0, i]) for word, i in vec.vocabulary_.items()]
    words_freq =sorted(words_freq, key = lambda x: x[1], reverse = True)

    return words_freq[:n]
We’ll use the get_trigrams() and get_bigrams() functions we created above to apply to each of the sentiment dataframes and save the top 15 values in a new dataframe so we can analyse it in a later step.
promoter_bigrams = get_bigrams(df_promoter['text'], n=15)
promoter_bigrams_df = pd.DataFrame(promoter_bigrams)
promoter_bigrams_df.columns=["Bigram", "Frequency"]

passive_bigrams = get_bigrams(df_passive['text'], n=15)
passive_bigrams_df = pd.DataFrame(passive_bigrams)
passive_bigrams_df.columns=["Bigram", "Frequency"]

detractor_bigrams = get_bigrams(df_detractor['text'], n=15)
detractor_bigrams_df = pd.DataFrame(detractor_bigrams)
detractor_bigrams_df.columns=["Bigram", "Frequency"]

promoter_trigrams = get_trigrams(df_promoter['text'], n=15)
promoter_trigrams_df = pd.DataFrame(promoter_trigrams)
promoter_trigrams_df.columns=["Trigram", "Frequency"]

passive_trigrams = get_trigrams(df_passive['text'], n=15)
passive_trigrams_df = pd.DataFrame(passive_trigrams)
passive_trigrams_df.columns=["Trigram", "Frequency"]

detractor_trigrams = get_trigrams(df_detractor['text'], n=15)
detractor_trigrams_df = pd.DataFrame(detractor_trigrams)
detractor_trigrams_df.columns=["Trigram", "Frequency"]
If you print out one of the dataframes you’ll get a taste of the sort of data we’ve managed to extract using CountVectorizer for n-gram analysis.
Promoters
The promoters were those customers who rated companies a 9 or 10 in their reviews. They loved the service they received and it was either delivered flawlessly, or the company resolved any issues that arose in a way which impressed the customers.
Understanding the things they liked or loved can show you what impresses customers and could highlight where rivals are doing better. If you print out the promoter_bigrams_df and promoter_trigrams_df you’ll be able to see what phrases were most common among the people who rated the companies most positively.
promoter_bigrams_df
| Bigram | Frequency | |
|---|---|---|
| 0 | excellent service | 2833 |
| 1 | great service | 2515 |
| 2 | fast delivery | 2250 |
| 3 | service and | 2023 |
| 4 | very good | 1832 |
| 5 | good service | 1659 |
| 6 | quick delivery | 1294 |
| 7 | easy to | 1264 |
| 8 | land rover | 1101 |
| 9 | and fast | 1015 |
| 10 | thank you | 902 |
| 11 | on the | 870 |
| 12 | for my | 800 |
| 13 | customer service | 784 |
| 14 | fast and | 765 |
promoter_trigrams_df
| Trigram | Frequency | |
|---|---|---|
| 0 | very good service | 532 |
| 1 | and fast delivery | 523 |
| 2 | to deal with | 497 |
| 3 | service excellent service | 479 |
| 4 | excellent service and | 473 |
| 5 | excellent service excellent | 463 |
| 6 | great service and | 440 |
| 7 | great service great | 433 |
| 8 | easy to use | 431 |
| 9 | service great service | 382 |
| 10 | land rover parts | 314 |
| 11 | fast delivery and | 305 |
| 12 | and quick delivery | 288 |
| 13 | good service and | 278 |
| 14 | very fast delivery | 262 |
The n-gram analysis on the Promoters, as you would expect, find lots of generic praise for “very good service”, but “fast delivery” also stands out, so clearly this is something that matters to customers in the Land Rover spares market.
Passives
The passive customers were those who rated the businesses with a score of 7-8. Ordinarily, you might view that as pretty good, but NPS says that these customers were a bit indifferent. They weren’t really upset with the service, but they weren’t blown away by it either. It was just “meh.”
The theory is that these passive customers are more likely to defect to a rival than the promoters who rated the company a 9 or 10. Understanding, a bit more about what didn’t “wow” them can help you make your service that little bit more impressive and memorable and turn more of these passives into promoters, which should help to increase your retention.
passive_bigrams_df
| Bigram | Frequency | |
|---|---|---|
| 0 | good service | 364 |
| 1 | very good | 249 |
| 2 | on the | 242 |
| 3 | of the | 224 |
| 4 | in the | 178 |
| 5 | great service | 173 |
| 6 | fast delivery | 147 |
| 7 | easy to | 147 |
| 8 | service and | 146 |
| 9 | to be | 129 |
| 10 | with the | 124 |
| 11 | for the | 124 |
| 12 | land rover | 116 |
| 13 | the parts | 113 |
| 14 | and the | 113 |
passive_trigrams_df
| Trigram | Frequency | |
|---|---|---|
| 0 | very good service | 59 |
| 1 | good service good | 57 |
| 2 | easy to use | 50 |
| 3 | good service and | 48 |
| 4 | service good service | 45 |
| 5 | on the website | 43 |
| 6 | to deal with | 43 |
| 7 | land rover parts | 31 |
| 8 | great service and | 31 |
| 9 | one of the | 31 |
| 10 | with the service | 30 |
| 11 | would have been | 27 |
| 12 | easy to navigate | 27 |
| 13 | my order was | 26 |
| 14 | it would be | 26 |
The n-gram analysis of the passive sentiment reviews is broadly similar to that of the promoters, which makes sense because 7 or 8 out of 10 is still a very positive score. Not much is revealed in the data here, so an alternative method might be needed to see if we can identify which factors could influence more customers to promote the businesses they buy from.
Detractors
Finally, the detractors experienced a service level which was below their expectations and gave the companies ratings of 1-6 as a result. Here, the trigram analysis was much more useful as the bigram analysis contained lots of relatively useless stopwords. These are easy to remove, but make the text a bit less readable, so I left them in for demonstration purposes.
detractor_bigrams_df
| Bigram | Frequency | |
|---|---|---|
| 0 | on the | 408 |
| 1 | of the | 348 |
| 2 | in the | 320 |
| 3 | the order | 311 |
| 4 | my order | 306 |
| 5 | to be | 299 |
| 6 | it was | 249 |
| 7 | for the | 236 |
| 8 | the parts | 226 |
| 9 | had to | 215 |
| 10 | to get | 211 |
| 11 | customer service | 209 |
| 12 | and the | 207 |
| 13 | to the | 203 |
| 14 | in stock | 187 |
The detractor trigrams suggestion that internet retailers in the Land Rover spares sector have a big issue with stock. The data suggests that customers might be ordering things they think are in stock, only to find they’re not.
Furthermore, it looks like calls made to the customer service teams aren’t providing a consistent answer. The “and was told”, “to be told”, “on the phone”, “still waiting for”, and “out of stock” trigrams are all signs that improvement is needed here. There are probably some easy fixes these businesses can apply to resolve some of these issues.
detractor_trigrams_df
| Trigram | Frequency | |
|---|---|---|
| 0 | out of stock | 65 |
| 1 | still waiting for | 65 |
| 2 | the order was | 47 |
| 3 | placed an order | 47 |
| 4 | the next day | 47 |
| 5 | it would be | 46 |
| 6 | not in stock | 42 |
| 7 | in stock and | 42 |
| 8 | on the phone | 42 |
| 9 | poor customer service | 38 |
| 10 | and was told | 37 |
| 11 | my order and | 37 |
| 12 | to be told | 37 |
| 13 | my order was | 36 |
| 14 | next day delivery | 35 |
In more sophisticated markets, what you’ll generally find here is that the negative feedback tends to be about couriers and not your own business. By analysing your cases, returns, and customer reviews and feedback, you’ll hopefully have fixed most of the issues with your own business. The issues with couriers are, of course, largely outside your control. However, instead of ignoring these and falling into the trap of thinking you can’t fix these issues, you should instead test using them as an opportunity to utilise service recovery.
In every online retail business where I’ve applied it, service recovery has worked brilliantly. However, it’s often rejected by senior management, whose often operational mindset sees the cost of issuing service recovery and not the value of the customer retained and tries to limit or prevent the strategy.
5. The Bag-of-Words model
We’ve looked at two and three word phrases using n-gram analysis, so next we’ll look at the individual words using an NLP model called Bag-of-Words or BoW. As the name suggests, the Bag-of-Words model identifies all the unique words found in the text (or corpus) and then calculates their prevalence. It’s called a “bag of words” because, unlike the n-gram analysis we used above, the order in which the words appear isn’t important. We just want to see how often unique words occur, so we can see which ones are common to promoters, passives, and detractors.
The Bag-of-Words model can actually be used for much more than this. We’re only going to use the approach for unigram analysis, but you can also create a vector for each set of text and record the presence of each word across documents within a corpus, allowing you to convert text to a numeric representation that can be used within a machine learning model. The approach could easily be applied here to predict the reviews score from the vectors using sentiment analysis of the bag of words.
Tokenization
First, we’ll apply a technique called tokenization using the Python Natural Language Toolkit (NLTK). This will
extract all the words found in each review text and assign them to a Python list we can store in our dataframe as
words.
import nltk
nltk.download('punkt')

def apply_tokenization(row):
    content = row['text']
    tokens = nltk.word_tokenize(content)
    return [w for w in tokens if w.isalpha()]

df['words'] = df.apply(apply_tokenization, axis=1)
df[['text', 'words']].head()
| text | words | |
|---|---|---|
| 0 | great products and service if only all compani... | [great, products, and, service, if, only, all,... |
| 1 | ordered a few bits from the website ordered a ... | [ordered, a, few, bits, from, the, website, or... |
| 2 | absolutely stellar customer service always ver... | [absolutely, stellar, customer, service, alway... |
| 3 | great customer service when i called to discus... | [great, customer, service, when, i, called, to... |
| 4 | happy customer promt and professional service | [happy, customer, promt, and, professional, se... |
Porter stemming
Now we have extracted our words into a Python list for each review, we can do some further processing on the text. Firstly, we’ll apply a technique called “stemming”.
There are a few different algorithms for performing text stemming in Python, we’ll use the popular Porter stemming approach via the PorterStemmer model included in NLTK. This will take each words and trim it back to its stem. For example, “deliver”, “delivery” and “delivered” would all revert back to the stem word of “deliver”, allowing these related phrases to be analysed as if they were one word, reducing noise in the data.
To perform Porter stemming, we load up the PorterStemmer class and create a simple function to apply the stem() function to the words column of our dataframe, which contains the Python list of words we created using tokenization.
from nltk.stem.porter import PorterStemmer
stemmer = PorterStemmer()

def apply_stemming(row):
    word_list = row['words']
    return [stemmer.stem(word) for word in word_list]

df['stemmed_words'] = df.apply(apply_stemming, axis=1)
df[['words', 'stemmed_words']].head()
| words | stemmed_words | |
|---|---|---|
| 0 | [great, products, and, service, if, only, all,... | [great, product, and, servic, if, onli, all, c... |
| 1 | [ordered, a, few, bits, from, the, website, or... | [order, a, few, bit, from, the, websit, order,... |
| 2 | [absolutely, stellar, customer, service, alway... | [absolut, stellar, custom, servic, alway, veri... |
| 3 | [great, customer, service, when, i, called, to... | [great, custom, servic, when, i, call, to, dis... |
| 4 | [happy, customer, promt, and, professional, se... | [happi, custom, promt, and, profession, servic] |
Stop word removal
At present, there’s a bit of noise in our text data in the form of “stop words”. These are words like “and”, “the”, and “of”, which have little value to us when viewed independently. Removing stop words is another good way of removing noise from the data to reveal the words that matter.
Again, NTLK includes a useful stopwords model which can be used to remove meaningless stop words from text using a dictionary in your chosen language. As with the previous steps, we’ll run this on the output from the Porter stemming model data so we can apply the approaches and better process our text.
from nltk.corpus import stopwords
nltk.download('stopwords');
stops = set(stopwords.words("english"))

def apply_stopwords(row):
    word_list = row['stemmed_words']
    return [word for word in word_list if not word in stops]

df['stem_no_stopwords'] = df.apply(apply_stopwords, axis=1)
df[['stemmed_words', 'stem_no_stopwords']].head()
By applying tokenization, then Porter stemming, then stop word removal, we end up with a smaller list of words with less of the noise.
| stemmed_words | stem_no_stopwords | |
|---|---|---|
| 0 | [great, product, and, servic, if, onli, all, c... | [great, product, servic, onli, compani, good, ... |
| 1 | [order, a, few, bit, from, the, websit, order,... | [order, bit, websit, order, bit, websit, came,... |
| 2 | [absolut, stellar, custom, servic, alway, veri... | [absolut, stellar, custom, servic, alway, veri... |
| 3 | [great, custom, servic, when, i, call, to, dis... | [great, custom, servic, call, discuss, potenti... |
| 4 | [happi, custom, promt, and, profession, servic] | [happi, custom, promt, profession, servic] |
Finally, we’ll re-join the individual stemmed words currently present in the stem_no_stopwords column of the dataframe to return a continuous text string. The output looks a bit weird, but it’s much more useful for analysis.
def rejoin_words(row):
    my_list = row['stem_no_stopwords']
    joined_words = ( " ".join(my_list))
    return joined_words

df['processed_text'] = df.apply(rejoin_words, axis=1)
| text | processed_text | |
|---|---|---|
| 0 | great products and service if only all compani... | great product servic onli compani good mud uk ... |
| 1 | ordered a few bits from the website ordered a ... | order bit websit order bit websit came veri qu... |
| 2 | absolutely stellar customer service always ver... | absolut stellar custom servic alway veri swift... |
| 3 | great customer service when i called to discus... | great custom servic call discuss potenti order... |
| 4 | happy customer promt and professional service | happi custom promt profession servic |
6. Unigram analysis
Now we’ve done some additional natural language processing, let’s examine the sentiment of common keywords across the data set to see if some are more likely to be associated with positive feedback than negative. We’ll use the CountVectorizer model again, only this time we’ll examine “unigrams”, or individual words, rather than commonly occurring two- or three-word phrases.
First, we need to add the processed_text data to new dataframes based on whether the overall NPS we inferred was promoter, passive, or detractor.
df = df[['item_reviewed', 'processed_text', 'detractor', 'passive', 'promoter']]

df_detractor = df[df['detractor']==1]
df_passive = df[df['passive']==1]
df_promoter = df[df['promoter']==1]
Now we can use the same CountVectorizer approach we used earlier, adjusting the function so it returns n-grams of one. We’ll run this on the three sentiment dataframes and save the distributions of unigrams the CountVectorizer() model calculates.
from sklearn.feature_extraction.text import CountVectorizer

def get_unigrams(descriptions, n=None):

    vec = CountVectorizer(ngram_range = (1,1), max_features = 20000).fit(descriptions)
    bag_of_words = vec.transform(descriptions)
    sum_words = bag_of_words.sum(axis = 0)
    words_freq = [(word, sum_words[0, i]) for word, i in vec.vocabulary_.items()]
    words_freq =sorted(words_freq, key = lambda x: x[1], reverse = True)

    return words_freq[:n]

promoter_unigrams = get_unigrams(df_promoter['processed_text'], n=15)
promoter_unigrams_df = pd.DataFrame(promoter_unigrams)
promoter_unigrams_df.columns=["Unigram", "Promoters"]

passive_unigrams = get_unigrams(df_passive['processed_text'], n=15)
passive_unigrams_df = pd.DataFrame(passive_unigrams)
passive_unigrams_df.columns=["Unigram", "Passives"]

detractor_unigrams = get_unigrams(df_detractor['processed_text'], n=15)
detractor_unigrams_df = pd.DataFrame(detractor_unigrams)
detractor_unigrams_df.columns=["Unigram", "Detractors"]
Next we will extract all of the unique unigrams from the three dataframes and put them into a new dataframe called df_unigrams.
unigrams_df = pd.concat([promoter_unigrams_df['Unigram'],
                         passive_unigrams_df['Unigram'],
                         detractor_unigrams_df['Unigram']],
                         ignore_index=True,
                         sort=False)
unigrams_df = unigrams_df.drop_duplicates().reset_index(drop=True).to_frame()
Then we’ll use the Pandas merge() function to join the counts of passives, detractors, and promoters per unigram and add it all to the dataframe, filling any NaN values with zero. This gives us a frequency distribution by sentiment for every unigram in the dataset.
unigrams_df = unigrams_df.merge(promoter_unigrams_df, on='Unigram', how='left')
unigrams_df = unigrams_df.merge(passive_unigrams_df, on='Unigram', how='left')
unigrams_df = unigrams_df.merge(detractor_unigrams_df, on='Unigram', how='left')
unigrams_df = unigrams_df.fillna(0).set_index('Unigram')
unigrams_df
| Promoters | Passives | Detractors | |
|---|---|---|---|
| Unigram | |||
| servic | 13879.0 | 1208.0 | 761.0 |
| good | 9198.0 | 1720.0 | 672.0 |
| veri | 7493.0 | 786.0 | 549.0 |
| deliveri | 7319.0 | 1004.0 | 1050.0 |
| part | 6554.0 | 1073.0 | 1614.0 |
| great | 6408.0 | 566.0 | 0.0 |
| excel | 5912.0 | 0.0 | 0.0 |
| fast | 5595.0 | 386.0 | 0.0 |
| order | 5487.0 | 998.0 | 2460.0 |
| price | 4452.0 | 506.0 | 0.0 |
| quick | 3540.0 | 0.0 | 0.0 |
| wa | 3502.0 | 927.0 | 1834.0 |
| paddock | 2998.0 | 476.0 | 748.0 |
| use | 2859.0 | 350.0 | 0.0 |
| time | 2782.0 | 480.0 | 742.0 |
| item | 0.0 | 374.0 | 757.0 |
| product | 0.0 | 359.0 | 0.0 |
| day | 0.0 | 0.0 | 866.0 |
| 0.0 | 0.0 | 804.0 | |
| thi | 0.0 | 0.0 | 802.0 |
| receiv | 0.0 | 0.0 | 578.0 |
| ship | 0.0 | 0.0 | 549.0 |
Finally, we’ll use Matplotlib to make a horizontal bar chart of the volume of unigram occurrences across the three NPS datasets.
from matplotlib import pyplot as plt

unigrams_df.plot(kind='barh', stacked=True, figsize=(20, 15))

plt.title("Unigrams by NPS score")
plt.xlabel("Mentions")
plt.ylabel("Unigrams")
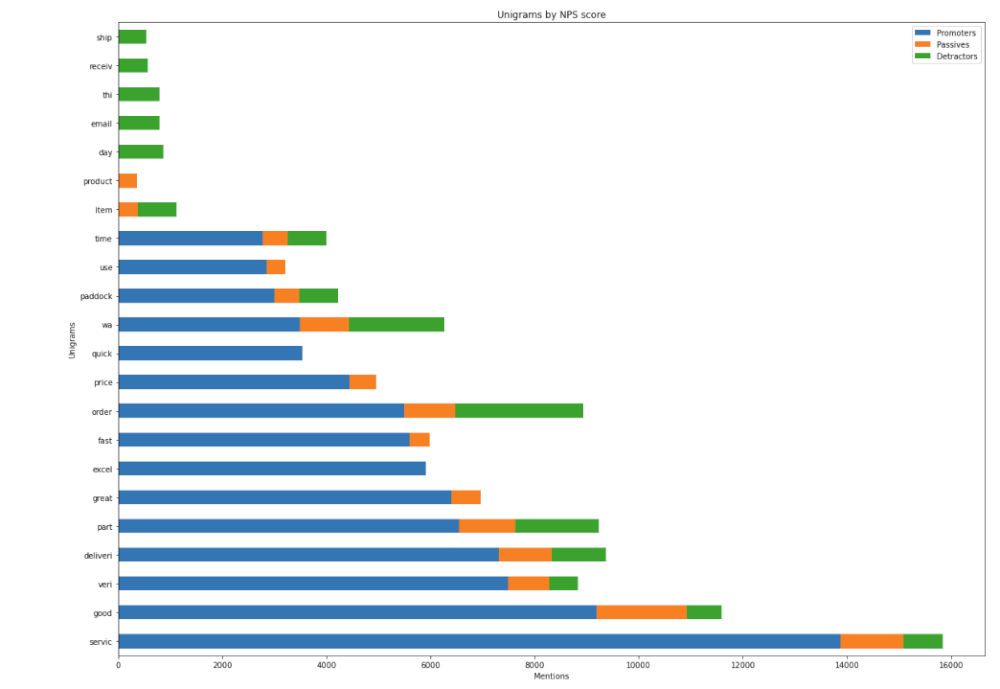
What the data show
The unigram approach does reveal some trends that were harder to spot using bigrams and trigrams. The data imply that the issues in Land Rover spares market revolve around late deliveries, incorrect stock levels on websites, and failure to supply the customers with their orders in the time they expected.
Price and speed of delivery are key, and providing these two expectations are met, customers seem pretty satisfied. However, if they place an order and it can’t be shipped because the supplier has no stock, or the courier delivers it late, they’ll be annoyed.
The data suggests there’s also an issue in this market with communication. Many of the customers who were detractors mentioned “email”, “day”, “ship”, and “order” in their review, which might indicate that they had to make contact with the suppliers to find out where their order was or deal with some other kind of issue.
Obviously, some of these are unavoidable, but they’re all fixable, in some way, so there’s a nice opportunity for the companies here to make some adjustments and increase their NPS scores, customer satisfaction and retention.
7. Use the data to shape your ecommerce strategy
Maybe I have a blinkered view because I’ve managed ecommerce sites for the past decade, but I think it’s become pretty easy to provide a “good” ecommerce service in recent years. Most experienced people working in the internet retail sector know what customers expect so are providing a better service, and this has in turn raised customer expectations.
In niche sectors, where staff may not have a formal background or training in ecommerce, I would anecdotally suggest that customer expectations would be more likely to exceed the level of service many ecommerce businesses are providing. Some might argue that they provide a service which is comparable to their market rivals, but that’s not how their customers will subliminally benchmark them. Being “good” is no longer good enough.
Customers do not judge you against the probably mediocre rivals in your niche. They judge you against everyday websites, like Amazon, Asos, and John Lewis.
The fact that competitors in niche sectors are often unsophisticated is obviously great news if you work in one, but you actually know what you’re doing. It means you can easily move ahead of your rivals with some relatively trivial changes which make your ecommerce offering more customer centric, and hopefully let you acquire and retain more customers. You need to try and make yourself stand out and be more memorable than the rest.
The Land Rover Defender spares market I randomly selected is arguably a good example of this. The companies seem similar in overall performance and share many of the same pains, especially with couriers and stock levels - possibly because they either have inadequate stock systems or poor suppliers.
Often, it’s not simply that rivals provide a better service than you, it’s just that they’re better at rectifying problems and appeasing customers when inevitable mistakes occur.
How you respond to issues affects how memorable your brand will be, and can increase the loyalty you obtain over and above what you’d get if the same customers had experienced a perfect, but un-memorable service. Find out what matters to the customers in your market - both in terms of promoters, detractors, and passives - and you could identify the changes you need to make to give your company the edge.
Further reading
-
Hanni, A.R., Patil, M.M. and Patil, P.M., 2016, September. Summarization of customer reviews for a product on a website using natural language processing. In 2016 International Conference on Advances in Computing, Communications and Informatics (ICACCI) (pp. 2280-2285). IEEE.
-
Kushwaha, M.L. and Rathod, M.S.D., 2016. Opinion mining of customer reviews based on their score using machine learning techniques. Analysis, 4, p.5.
Matt Clarke, Wednesday, March 03, 2021


Other posts you might like

How to tune a LightGBMClassifier model with Optuna
The LightGBM model is a gradient boosting framework that uses tree-based learning algorithms, much like the popular XGBoost model. LightGBM supports both classification and regression tasks, and is known for...

How to create a customer retention model with XGBoost
Although all business know the importance of retaining customers, few companies are actually able to measure customer retention accurately, and fewer still can predict which ones will churn or be...
