In ecommerce, coupons, voucher codes, or discount codes are widely used for meeting a range of different sales objectives. They can encourage new customers to make their first purchase, encourage...
Google recently announced that it will be sunsetting Universal Analytics and replacing it with Google Analytics 4. The news sent shock waves through the ecommerce and marketing world, as it...
Google Analytics 4 uses a completely different set of dimensions and metrics to Google Analytics 3 or Universal Analytics. In this project I’ll show you how to get back a...
Average Order Value or AOV is one of the most critical ecommerce metrics. Along with your sessions and conversion rate, it ultimately controls how much revenue an ecommerce business generates....
To extract specific data from the Google Analytics API you will often need to use segments and filters to ensure you get the data you want. For example, you might...
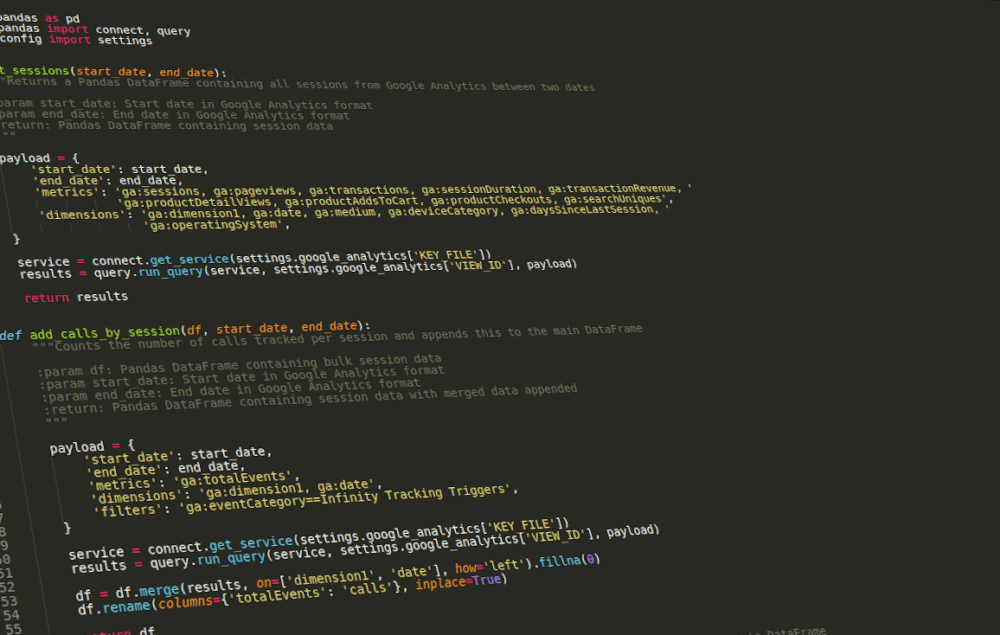
Google Analytics provides a useful Shopping Behaviour Analysis report that lets you examine the volumes of users who are performing important actions on your ecommerce website, such as viewing products,...
The demographics and interests data provided in Google Analytics can be a useful way to understand who is visiting your site or purchasing your products, without the need to perform...
The Lin Rodnitzky Ratio is a calculation designed to help search engine marketers assess the management of paid search campaigns and account structure. When managing paid search advertising accounts you...
Ecommerce purchase intention models analyse click-stream consumer behaviour data from web analytics platforms to predict whether a customer will make a purchase during their visit. These online shopping models are...
The Neural Prophet model is relatively new and was heavily inspired by Facebook’s earlier Prophet time series forecasting model. NeuralProphet is a neural network based model that uses a PyTorch...
While reporting is often quite a useful way to stay on top of your data, it’s also something you can automate to save time, even if your reports include custom...
Like most people who work in ecommerce and marketing, I spend a lot of time in Google Analytics. It’s a great tool, but when reporting on the numbers, it helps...
In the ecommerce sector, one of the most common tasks you’ll undertake after arriving at work each morning is to check over the recent analytics data for your site and...
Time series data have a reputation for being somewhat complicated, partly because they’re made up of a number of different components that work together. At the most basic level these...
The Google Analytics Measurement Protocol API lets you add data to your GA account that hasn’t been triggered by a user visiting a web page. Since it’s so flexible, you...
Line charts, line graphs, or line plots are among the most widely used data visualisations. They’re ideal for time series data in which you’re plot a metric on the y...
Heatmaps are one of the most intuitive ways to display data across two dimensions, and they work particularly well on temporal data, such as web analytics metrics. They’re a great...
The Google Analytics add-on for Google Sheets allows you to use the Google Analytics reporting API to create custom weekly reports and schedule them to run. However, to run a...
Market Basket Analysis, or MBA, is a subset of affinity analysis and has been used in the retail sector for many years. It provides a computational method for identifying common...
Over the past decade I’ve written more Google Analytics API queries than I can remember. Initially, I favoured PHP for these (and still do for permanent web-based applications utilising GA...