Have you ever needed to chop the top or bottom off a Pandas dataframe, or extract a specific section from the middle? If so, there’s a Pandas function called truncate()...
The Pandas filter() function is used to filter a dataframe based on the column names, rather than the column values, and is useful in creating a subset dataframe containing only...
The Pandas shift() function is used to shift the position of a dataframe or series by a specified number of periods. It’s commonly used for the creation of so-called lagged...
The Pandas to_json() function is one of a number of Pandas functions that allow you to export the data stored in a dataframe into other formats, in this case JavaScript...
The Pandas query() function is an awesome tool for filtering Pandas dataframes. It takes simple string arguments on column names and uses standard Pandas operators that allow you to easily...
Pandas’ versatility means that there are loads of different ways to create a dataframe. The Pandas from_dict() function is one of the most common ways to create a dataframe from...
Simple moving averages, or SMAs, show the average value for a numeric value over a specific number of previous periods and are very useful in time series analysis, both as...
The Pandas pipe() function takes a dataframe as its input, transforms or manipulates it, and returns the transformed dataframe. It is a very useful function that can be used to...
The Pandas assign() function is used to create new columns in a dataframe, usually based on calculations. The assign() function takes the name of the new column to create along...
The Pandas library is under constant development and new features are added regularly. This means that code you may read about online may not work if you are running an...
The Pandas library is so versatile that it provides several ways to create a dataframe. One of the most commonly used is the from_dict() method, which allows you to create...
Pandas method chaining, or flow programming, is a modern, but sometimes controversial way of structuring Pandas code into a structured chain or series of commands. Conceptually, Pandas chaining is a...
When working with numeric data in Pandas you’ll often need to round numbers to the nearest whole number, round them up, round them down, or round them to two decimal...
When working with Pandas dataframes that contain many columns, or those containing very large amounts of content, it is often useful to display the dataframe by flipping its orientation through...
Many Pandas functions require data to be stored in the correct data type, or dtype as it’s known. For example, “£32,232.92” will be recognised as an object data type because...
While many Pandas operations don’t require or benefit from an explicitly named index on the dataframe, named indexes (or indices) can be beneficial for some tasks because a wide range...
Lamdba functions are small anonymous functions that don’t need to be defined with a name. If you’re creating a function to solve a specific problem in Pandas and there’s little...
While Pandas handles large datasets rather well, it can sometimes struggle with memory in certain situations. Thankfully, there are a few things you can do to reduce the amount of...
When working with Pandas dataframes you’ll often need to calculate the percentage change or percentage difference between the values in two columns. There are various ways to do this in...
Spearman’s rank correlation coefficient, sometimes called Spearman’s rho, is a nonparametric statistic used to measure rank correlation, or the statistical dependence between the rankings of two variables. It explains how...
As I showed in my previous tutorial on named entity recognition in Spacy, the EntityRuler allows you to customise Spacy’s default NER model to allow you to create your own...
The Pandas rolling() method can be used to calculate a rolling mean or rolling average (also known as a moving average), which is simply the mean of a specific time...
As you add new columns to Pandas dataframes they’ll often start to get large and the columns may appear in an order that no longer makes sense. To make your...
The Pandas split() function lets you split a string value up into a list or into separate dataframe columns based on a separator or delimiter value, such as a space...
When dealing with more complex datasets, you’ll often find that Pandas dataframe columns contain data stored as Python lists. While these are easy to store, they do take a little...
Standard deviation, STD or STDEV, is a descriptive statistic that measures the dispersion of a dataset relative to its mean and is calculated as the square root of the variance....
The Pandas sample() function is used to show a random sample of data from a dataframe. The sample() function is useful for quickly checking the data in a dataframe, and...
The Pandas concat() function is used to concatenate (or join together) two or more Pandas objects such as dataframes or series. It can be used to join two dataframes together...
While the Pandas drop() method is probably the most common way to drop columns or remove columns from a Pandas dataframe, there is another lesser known method you can also...
One of the first things you’ll do whenever you import a Pandas dataframe is view the data to check that it’s formatted correctly and see what you’re dealing with. It’s...
The Pandas append() function is commonly used for appending or adding new rows to the bottom of an existing Pandas dataframe, or joining or concatenating dataframes vertically. However, while still...
When working with Pandas dataframes it really helps to have clear and consistent naming conventions for column labels or column names, and for the column values themselves. Adding a prefix...
When working with categorical data in Pandas dataframes, it can help to get an understanding of the number of times a given value appears - a feature called “cardinality.” The...
When working with Pandas dataframes you’ll often need to drop, remove, or delete columns or rows from a dataframe to leave you with a clean dataframe containing tidier data you...
The Pearson correlation coefficient, or PCC, is the standard statistical method for computing pairwise or bivariate correlation in Pandas. It’s so commonly used in statistics, that it is often referred...
Pandas includes some incredible features for working with dates and times. The Pandas date_range() function is used to create a range of dates and can be used to create a...
Slugification is the process of removing non-alphanumeric characters from a string and replacing spaces with underscores. Slugifying data is really useful for data scientists and can be used to both...
Duplicate values are a common occurrence in data science, and they come in various forms. Not only will you need to be able to identify duplicate values, but you will...
When working with Pandas, you’ll often need to identify and count unique values in a DataFrame. This is a common task in data science, and Pandas provides two methods to...
When working with Pandas dataframes you’ll commonly need to sort the data in some way. This is easy to do with the sort_values() and sort_index() methods. These two methods allow...
When working with Pandas, you’ll often need to sort a dataframe by one or more columns. While the Pandas sort_values() method makes it easy to sort categorical data in alphabetical...
When working with a Pandas dataframe you’ll sometimes need to convert the dataframe or a series to a list or dictionary. There are certain operations that are easier to perform...
Pandas is extremely versatile and includes a wide range of different methods you can use to add a new column or series to an existing dataframe. Whether you want to...
When working with Pandas dataframes, you may sometimes encounter a column that contains a list of Python dictionaries or JSON objects. While this format doesn’t take up much space and...
When working with Pandas dataframes you’ll often need to convert values from one format to another. For example, you might need to convert a string to a float or an...
When working with Pandas dataframes, it’s a very common task to calculate the difference between two rows. For example, you might want to calculate the difference in the number of...
Real world data is rarely clean, and you’ll often encounter missing values when working with Pandas dataframes. Missing values can lead to errors in your code, and can cause models...
When loading data into a Pandas dataframe, you’ll often find that data is truncated, columns are replaced with an ellipsis, or that the float precision makes numbers harder to read....
Data comes in many forms, from integers and floats, to strings, dates, and timedeltas. These different types of data are known as data types, or in Pandas dtypes, and using...
When working with data, one common thing you’ll be tasked with doing is identifying what’s changed. For example, let’s say you’ve used your web scraping skills to build an ecommerce...
Pandas, the Python Data Analysis Library, is the number one tool in data science and is a great reason to start learning Python programming. Irrespective of the data science project...
When working in Pandas you’ll sometimes encounter data stored in a single column that would actually be better presented when split into separate columns. For example, a Pandas column might...
The Pandas package is one of the main reasons why so many data scientists favour Python over Microsoft Excel. Pandas is incredibly powerful and versatile and can handle a wide...
Whether you call it data binning, data bucketing, or data discretization, the technique of grouping numeric data together is an exceptionally powerful one in data science, statistics, and machine learning....
In ecommerce, coupons, voucher codes, or discount codes are widely used for meeting a range of different sales objectives. They can encourage new customers to make their first purchase, encourage...
Google recently announced that it will be sunsetting Universal Analytics and replacing it with Google Analytics 4. The news sent shock waves through the ecommerce and marketing world, as it...
Google Analytics 4 uses a completely different set of dimensions and metrics to Google Analytics 3 or Universal Analytics. In this project I’ll show you how to get back a...
ABC classification is a simple technique that is commonly used in inventory management and is based on the Pareto principle or 80/20 rule. This says that 80% of consequences come...
Renaming Pandas dataframe columns is a common task for the data scientist. Neat, consistent column names make your dataframe easier to read and your code cleaner to write and maintain....
Calculating the time difference between two dates in Pandas can yield useful information to aid your analysis, help you understand the data, and guide a machine learning model on making...
The Pandas apply() function allows you to run custom functions on the values in a Series or column of your Pandas dataframe. The Pandas apply function can be used for...
The Pandas describe() function generates descriptive statistics on the contents of a Pandas dataframe to show the central tendency, shape, distribution, and dispersion of variables. Examining descriptive statistics is the...
One of the problems with search engine optimisation or SEO is that search engine algorithms are essentially black boxes. They analyse so many on-page and off-page factors, and use multiple...
One of the most useful Python SEO projects you can undertake is to identify the top keywords for which each of your site’s pages are ranking for. Sometimes, these keywords...
If you regularly work with time series data, one common thing you’ll need to do is add and subtract days from a date. If you tried doing this by hand,...
Striking distance keywords are those which appear just off the bottom of the first page of search engine results. Keywords that appear on the first page have the greatest visibility...
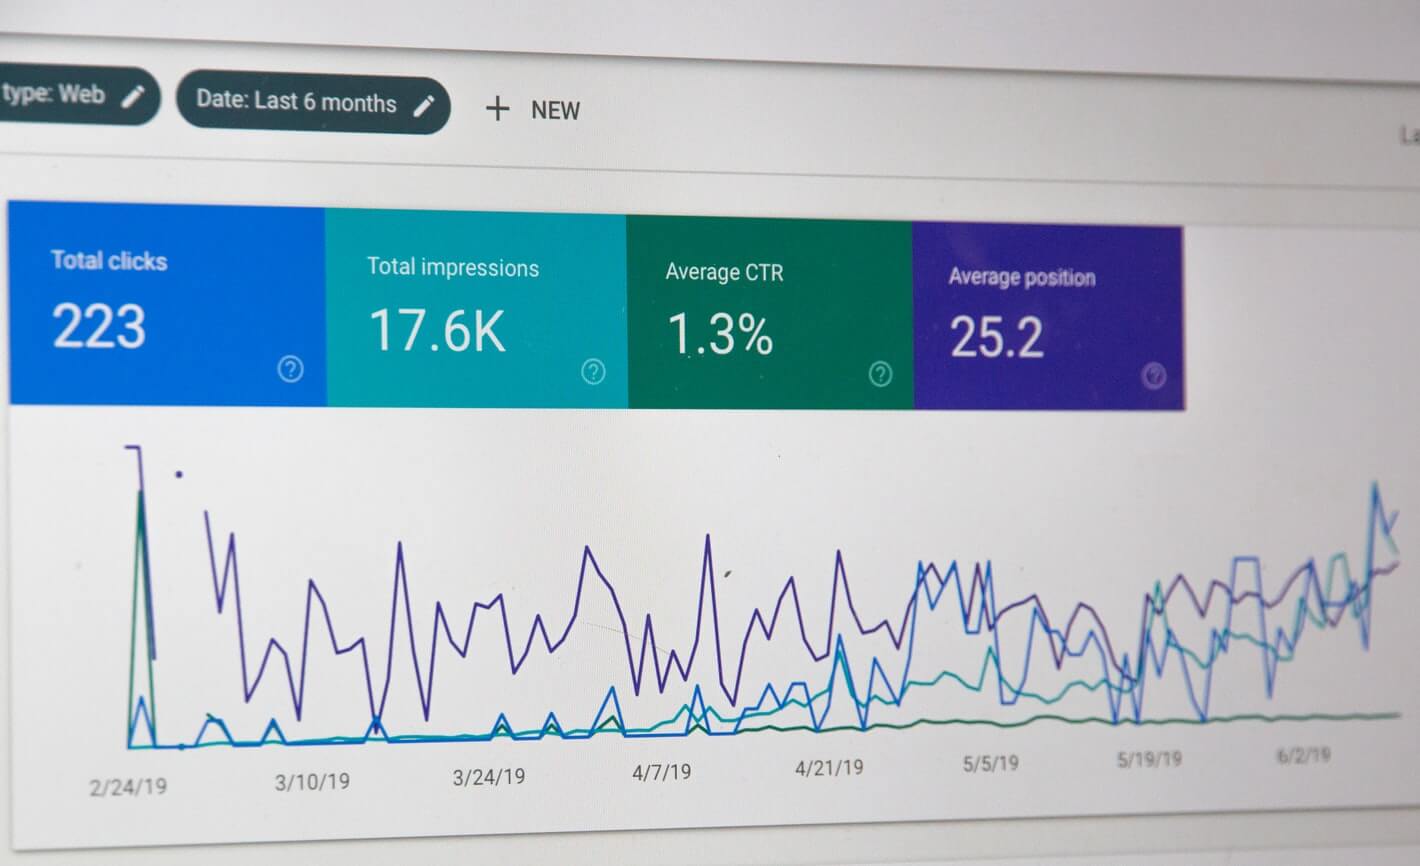
Google Search Console is a really useful tool for search marketers since it shows what is happening data-wise before organic search visitors reach your website. Google Analytics only shows you...
In ecommerce, email marketing remains one of the most effective (and cost-effective) digital marketing techniques, especially when combined with data science techniques. The vast amounts of customer data generated in...
The eBay Finding API gives you direct access to eBay search listings using a simple SDK. This API lets you search or query eBay to fetch specific search listings for...
The Zendesk customer service platform is widely used by ecommerce businesses, but its functionality for analysing ticket trends and automatically classifying them is somewhat limited. In many cases, you might...
The Google Search Console (GSC) API is a great source of information for those working in SEO, marketing, or ecommerce. It can tell you which of your pages are appearing...
GSpread is a Python package that makes it quick and easy to read and write data from Google Sheets spreadsheets stored in your Google Drive into Python. With a tiny...
The Lin Rodnitzky Ratio is a calculation designed to help search engine marketers assess the management of paid search campaigns and account structure. When managing paid search advertising accounts you...
Subscription commerce was all the rage for a while, but it’s not really become as popular as many in ecommerce perhaps envisaged. While we may have subscriptions for certain things,...
If you want to change careers and move into the data science or data mining field, as either a data scientist or a data engineer, or simply improve your skills,...
RSS feeds have been a mainstay on the web for over 20 years now. These XML-based documents are generated by web servers and designed to be read in RSS feed...
Although I have never really considered myself a technical SEO, I do need to do quite a bit of SEO work as part of my role as an Ecommerce Director....
Internal linking helps improve the user experience by recommending related content to users, which both reduces bounce rate, and helps search engine optimisation efforts. While there are no hard and...
EcommerceTools makes it really quick and easy to scrape Google search engine results in Python. In this simple project, we’ll use EcommerceTools to search Google for your chosen keywords, use...
Product recommender systems, or recommendation systems, as they’re also known are ubiquitous on e-commerce websites these days. They’re relatively simple to create and even fairly basic ones can give striking...
While reporting is often quite a useful way to stay on top of your data, it’s also something you can automate to save time, even if your reports include custom...
Like most people who work in ecommerce and marketing, I spend a lot of time in Google Analytics. It’s a great tool, but when reporting on the numbers, it helps...
While the Recency, Frequency, Monetary value or RFM model for customer segmentation might be old, it’s based on sound science, so no matter what customer model you’re building, it’s generally...
Cohort analysis is unlike most other customer segmentation techniques in that it typically uses a time-based element. It’s typically used to segment customers into groups, or cohorts, based on their...
Calculating Customer Lifetime Value or CLV is considered a really important thing in marketing and ecommerce, yet most companies can’t do it properly. This clever metric tells you the predicted...
RFM segmentation is one of the oldest and most effective ways to segment customers. RFM models are based on three simple values - recency, frequency, and monetary value - which...
Purchase latency or customer latency is a measure of the number of days between a customer’s orders and is one of the most powerful features in many propensity and churn...
As I explained in my previous post, many B2B ecommerce businesses spend huge amounts on procuring third-party data for companies they wish to target. However, with some data science skills...
If you regularly work with ecommerce data, you’re likely to have encountered PHP serialized arrays or objects. Serialization is a process used to take a complex data structure, such as...
Keyword cannibalisation occurs when you have several pages ranking for the same phrase, effectively putting them in competition with each other for search engine rankings. Since Google generally only shows...
If, like me, you’ve come from a background where you made heavy use of SQL, then getting to grips with filtering, subsetting, and selecting data in Pandas can be a...
In the field sales sector, one common thing you’ll want to do is identify all the potential clients you have within a particular region, so you can assign your team...
Setting up keywords for new paid search accounts can be a repetitive and time-consuming process. While it’s historically been done using Excel, many digital marketers are now taking advantage of...
The Pandas value_counts() function can be used to count the number of times a value occurs within a dataframe column or series, as well as calculating frequency distributions. Here’s a...
For years, I used to spend much of my time performing Exploratory Data Analysis directly in SQL. Over time, the queries I wrote became very complicated, and it was often...
There are hundreds of excellent Python data science libraries and packages that you’ll encounter when working on data science projects. However, there are four of them that you’ll probably use...
Line charts, line graphs, or line plots are among the most widely used data visualisations. They’re ideal for time series data in which you’re plot a metric on the y...
Barplots or bar charts are probably the most widely used visualisation for displaying and comparing categorical variables. They’re very easy to understand and are quick and easy to generate.
Pearson’s product-moment correlation, or Pearson’s r, is a statistical method commonly used in data science to measure the strength of the linear relationship between variables. If you can identify existing...
Categorical data can be visualised in many ways, and there’s no requirement to stick to the standard bar chart. Here are a selection of attractive Seaborn charts, graphs, and plots...
Product matching (or data matching) is a computational technique employing Natural Language Processing, machine learning, or deep learning, which aims to identify identical products being sold on different websites, where...
Heatmaps are one of the most intuitive ways to display data across two dimensions, and they work particularly well on temporal data, such as web analytics metrics. They’re a great...
Recent papers on the Recency, Frequency, Monetary or RFM model, such as the one by Inanc Kabasakal in 2020, have started to adopt text-based labels to help people understand the...
Scatterplots, scatter graphs, scatter charts, or scattergrams, are one of the most popular mathematical plots and represent one of the best ways to visualise the relationship of data on two...
During the Exploratory Data Analysis or EDA stage one of the key things you’ll want to do is understand the statistical distribution of your data. Histograms are one of the...
The boxplot, or box-and-whisker diagram, is one of the most useful ways to visualise statistical distributions in data. While they can seem a bit unintuitive when you first look at...
Imbalanced classification problems, such as the detection of fraudulent card payments, represent a significant challenge for machine learning models. When the target class, such as fraudulent transactions, makes up such...
Something which often confuses non data scientists is that too many features can be a bad thing for a model. It does sound logical that including more features and data...
There are loads of different ways to convert categorical variables into numeric features so they can be used within machine learning models. While you can perform this process manually on...
Selecting, filtering and subsetting data is probably the most common task you’ll undertake if you work with data. It allows you to extract subsets of data where row or column...
When working with time series data, such as web analytics data or ecommerce sales, the time series format in your dataset might not be ideal for the analysis you’re performing...
If you regularly work with time series data in Pandas it’s probable that you’ll sometimes need to convert dates or datetimes and extract additional features from them.
Pandas allows you to import data from a wide range of data sources directly into a dataframe. These can be static files, such as CSV, TSV, fixed width files, Microsoft...
Transactional item data can be used to create a number of other useful datasets to help you analyse ecommerce products and customers. From the core list of items purchased you...
Time series forecasting models are notoriously tricky to master, especially in ecommerce, where you have seasonality, the weather, marketing promotions, and holidays to consider. Not to mention pandemics.
The predictive response models used to help identify customers in marketing can also be used to help outbound sales teams improve their call conversion rate by targeting the best people...
The things we search for online can reveal a remarkable amount about us, even when viewed in aggregate on an anonymous level. For many years, Google has made some of...
Image hashing (or image fingerprinting) is a technique that is used to convert an image to an alphanumeric string. While this might sound somewhat pointless, it actually has a number...
As everyone who works in ecommerce will know, stock-outs on your key lines can have a massive negative impact on sales and your marketing costs. In many cases, you’ll be...
When you’re building a Natural Language Processing model, it’s the text annotation process which is the most laborious and the most expensive for your business. While you can use tools...
Google Data Studio has native support for a range of platforms, but there’s no reliable means of pushing data in from Python without going via another data source. Google BigQuery...
Google BigQuery is a “serverless” data warehouse platform stored in the Google Cloud Platform. The serverless approach means you don’t have to maintain a server yourself and Google looks after...
While there are many open source datasets available for you to use when learning new data science techniques, sometimes you may struggle to find a data set to use to...
ABC inventory classification has been one of the most widely used methods of stock control in operations management for decades. It’s an intentionally simple system in which products are assigned...
Many MySQL databases are configured to accept connections from other servers on the local network and will reject connections from remote machines. Ordinarily, you could work around this by creating...
Data binning, bucketing, or discrete binning, is a very useful technique for both preprocessing and understanding or visualising complex data, especially during the customer segmentation process. It’s applied to continuous...
Most datasets you’ll encounter will probably contain categorical variables. They are often highly informative, but the downside is that they’re based on object or datetime data types such as text...
In both B2C and B2B ecommerce, special trading periods such as Christmas, Mothers’ Day, and Valentines’ Day can often greatly contribute to sales. Indeed, the introduction of Black Friday sales...
When you gain access to a new dataset, chances are, it’s probably not in the format you require for analysis or modeling. The most common problem you’ll encounter is datasets...
In ecommerce, it pays to watch what your competitors are doing, so over the past decade or so in which I’ve managed ecommerce businesses, I’ve regularly undertaken competitor analyses. They’re...
The massive versatility of Pandas means that you can create dataframes from almost any type of raw data. Whether you have a list, a list of lists, a dictionary, a...
Recommender systems, or recommendation engines as they’re also known, are everywhere these days. Whether you’re looking for books on Amazon, tracks on Spotify, movies on Netflix or a date on...
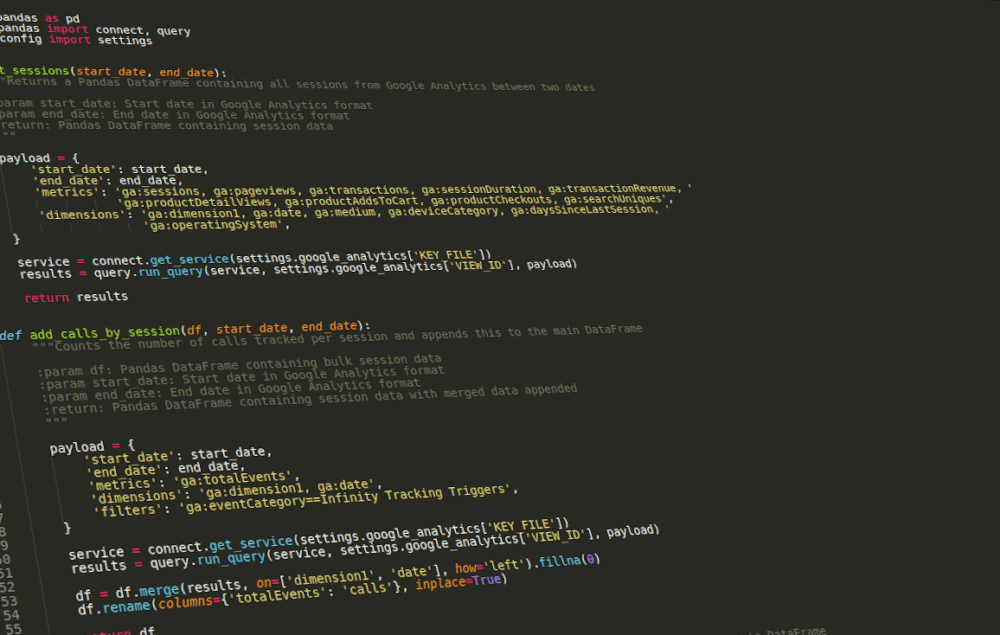
Over the past decade I’ve written more Google Analytics API queries than I can remember. Initially, I favoured PHP for these (and still do for permanent web-based applications utilising GA...
The scikit-learn package comes with a range of small built-in toy datasets that are ideal for using in test projects and applications. As they’re part of the scikit-learn package, you...
When you’re building a machine learning model, the feature engineering step is often the most important. From your initial small batch of features, the clever use of maths and stats...
As models require numeric data and don’t like NaN, null, or inf values, if you find these within your dataset you’ll need to deal with them before passing the data...
When dealing with temporal or time series data, the dates themselves often yield information that can vastly improve the performance of your model. However, to get the best from these...


![How to get and set Pandas cell values with at[] and iat[]](https://d33wubrfki0l68.cloudfront.net/7d372f657d991d76113eeebb1c547fc1c862aab1/40c7c/assets/images/posts/pexels-christina-morillo-1181271.jpg)