One of the key steps in the Exploratory Data Analysis process that comes before model development is to understand the statistical distribution of the variables or features within the data...
The Venn diagram is one of the most intuitive data visualisations for showing the overlap between two or three groups, or “sets”, of data. These diagrams were created in the...
Line charts, line graphs, or line plots are among the most widely used data visualisations. They’re ideal for time series data in which you’re plot a metric on the y...
Barplots or bar charts are probably the most widely used visualisation for displaying and comparing categorical variables. They’re very easy to understand and are quick and easy to generate.
Pearson’s product-moment correlation, or Pearson’s r, is a statistical method commonly used in data science to measure the strength of the linear relationship between variables. If you can identify existing...
Categorical data can be visualised in many ways, and there’s no requirement to stick to the standard bar chart. Here are a selection of attractive Seaborn charts, graphs, and plots...
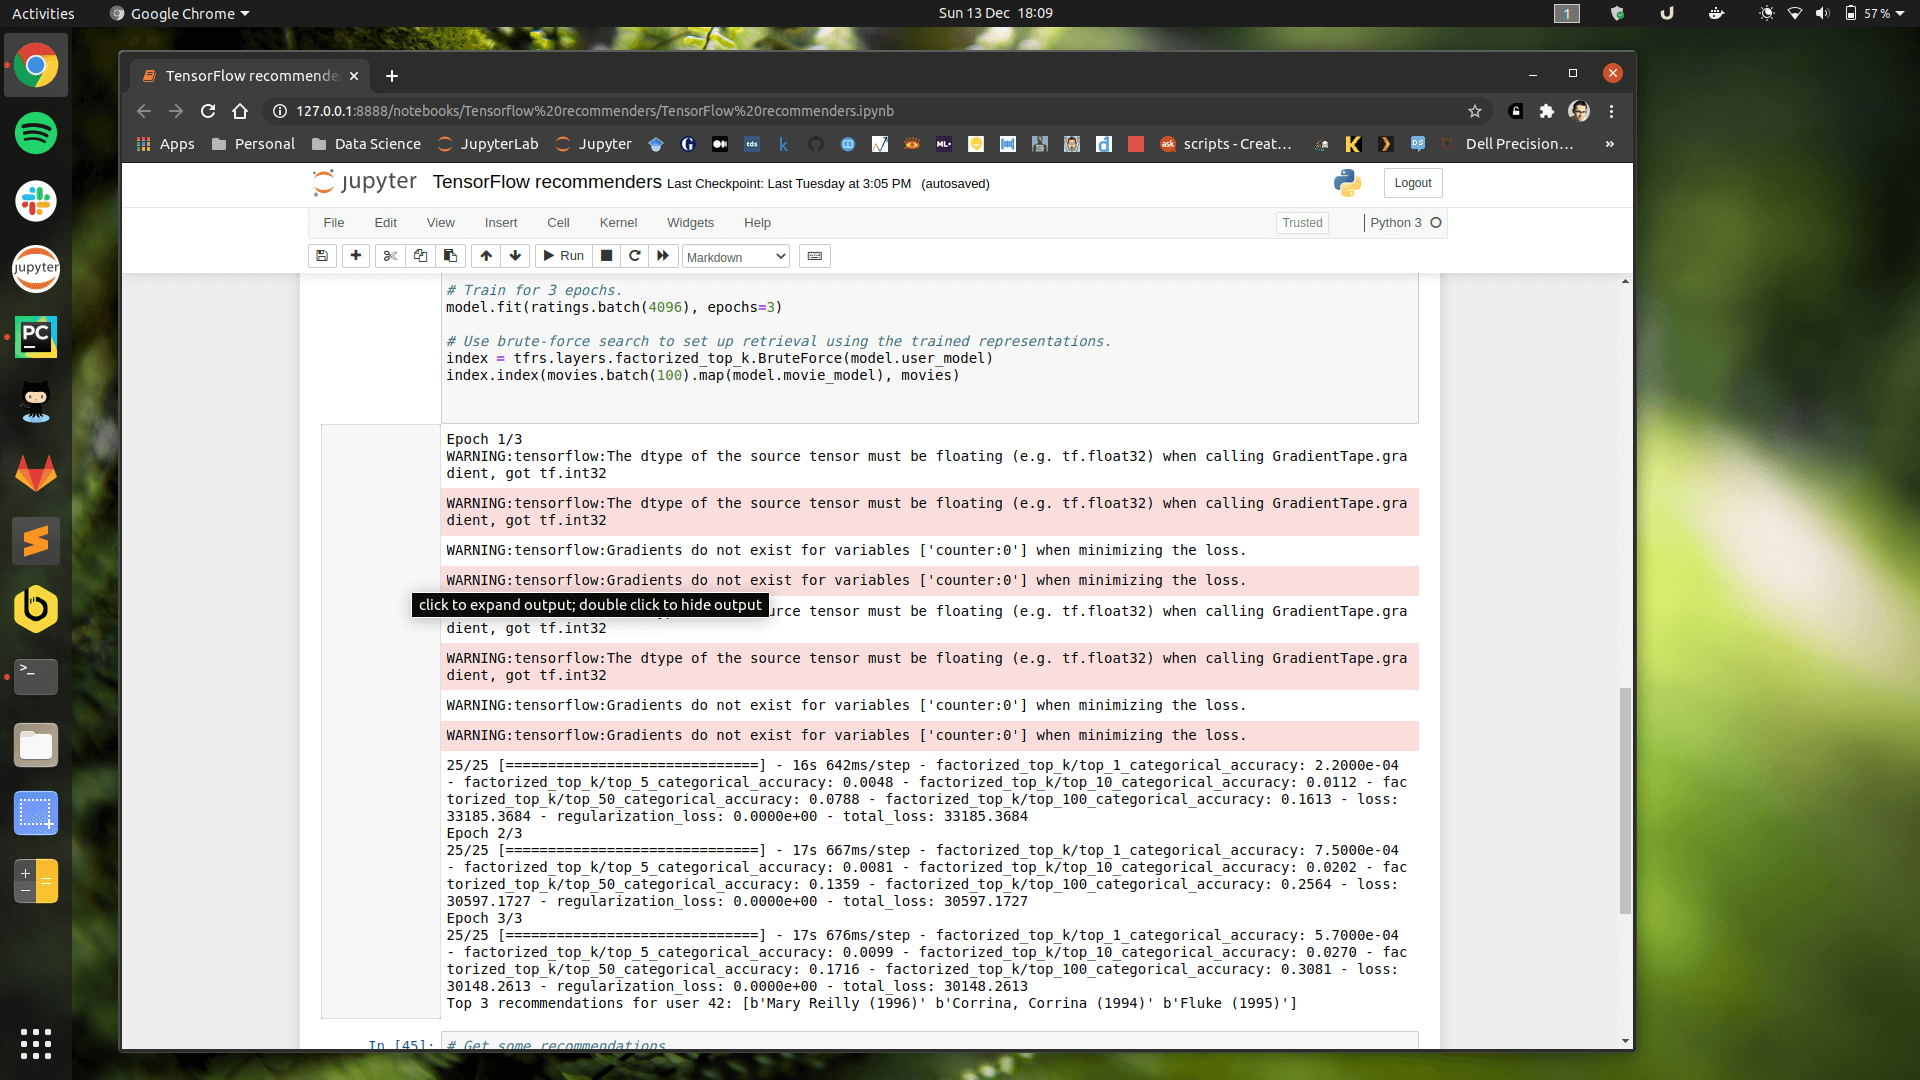
One of the most annoying aspects of working with GPU-accelerated data science software, such as NVIDIA Rapids, TensorFlow, PyTorch and XGBoost, is that it can sometimes be very complicated and...
There are numerous websites I use for my work that don’t have dedicated desktop applications designed for Ubuntu Linux, such as GitHub, GitHub Gists, GitLab and Jira. However, it’s now...