24 tutorials to get you started using Pandas for data science
Pandas is one of the best tools in data science and a great reason to learn Python. Here are 24 Pandas tutorials to help get you started.

Pandas, the Python Data Analysis Library, is the number one tool in data science and is a great reason to start learning Python programming. Irrespective of the data science project you’re working upon, nine times out of ten, it will use Pandas somewhere.
Although there’s a bit of a learning curve at first, Pandas quickly becomes intuitive and has many benefits over other systems, such as Microsoft Excel. If you want to succeed in data science, Pandas is the single Python library you need to master the most.
I’ve covered loads of different ways to use Pandas in previous tutorials, as well as practical ways you can apply Pandas to a wide range of data science problems in ecommerce and marketing. Work through these, and you’ll be up to speed in no time.
Working with Pandas dataframes
Pandas uses dataframes at its core. These are basically a bit like tables or spreadsheets that you can query with Pandas functions. Therefore, in any data science project your first step will typically be to create a Pandas dataframe, or import data into a Pandas dataframe.
 Picture by Markus Spiske, Unsplash.
1. Create a Pandas dataframe
Pandas lets you create dataframes in a wide range of ways, including from a Python list, from a Python dictionary, from Python tuples, or from any combinations of the above.
2. Import data into a Pandas dataframe
If you have an existing dataset, such as spreadsheet, you can import it straight into Pandas. Pandas supports a wide range of different file types and formats, so you’ll generally be able to easily import data, not matter how it’s provided.
3. Import data into Pandas from a database
If you don’t have data stored in a CSV or other file you can also query it in MySQL and other databases directly using Pandas and its SQL connection functionality. If you regularly work with databases and write queries that include complex joins, this approach can be a game changer.
Modifying Pandas dataframes
Once you’ve got data into your Pandas dataframe, you’ll almost certainly want to apply filters that select specific rows or columns, rename columns, or change the layout of the data. Pandas makes all these tasks relatively easy.
 Picture by Pixabay, Pexels.
4. Selecting and filtering data
Selecting or filtering data is the process of applying rules to the dataframe to show only specific rows or columns based on their values, allowing you to filter your data to a subset of the original data. It’s something you’ll use day in, day out.
5. Rename columns in a Pandas dataframe
Renaming columns is also very useful. Data imported from various sources will often have inconsistent column naming conventions, or duplicate column names, so renaming column names can keep your code neater and easier to maintain.
6. Reshaping data
Reshaping data is another common way to use Pandas. The melt() and pivot() functions are both great for this and let you convert wide format data into long format, and long format into wide format.
7. Export data from a Pandas dataframe
Finally, once you’ve reshaped, renamed, or filtered your Pandas data, you can also export it to CSV and a wide range of other file formats. All of these are simple one line commands and are very easy to use.
Exploratory Data Analysis
Exploratory Data Analysis or EDA is one of the main uses for Pandas. It’s essentially the process of examining your data in detail to understand data types, statistical distributions, correlations, and to dig deeper to answer any questions you may have about the dataset.
8. Create descriptive statistics from a dataframe
The describe() function is one of the most regularly used Pandas functions in EDA, and lets you create simple descriptive statistics on numeric and categorical values in the dataframe.
9. Grouping and aggregating data
Pandas also lets you group and aggregate data, which can be a great way to gain a better understanding and generate new data and new variables.
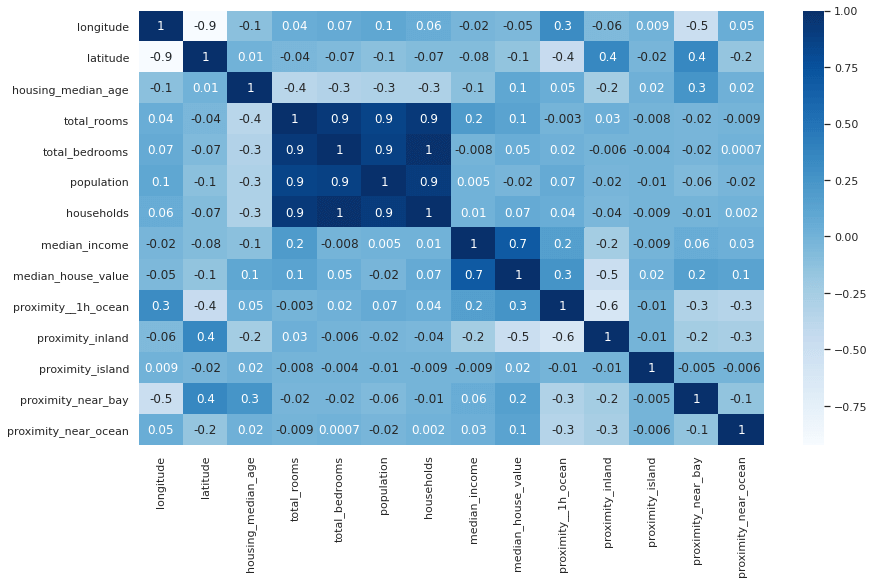
10. Correlation analysis
Correlation analysis, usually via Pearson’s correlation, lets you identify whether any of your variables are correlated with each other, or a target variable. For example, maybe you have a churn dataset, and you want to find out which customers are most likely to churn. Correlation analysis can give you a good steer.
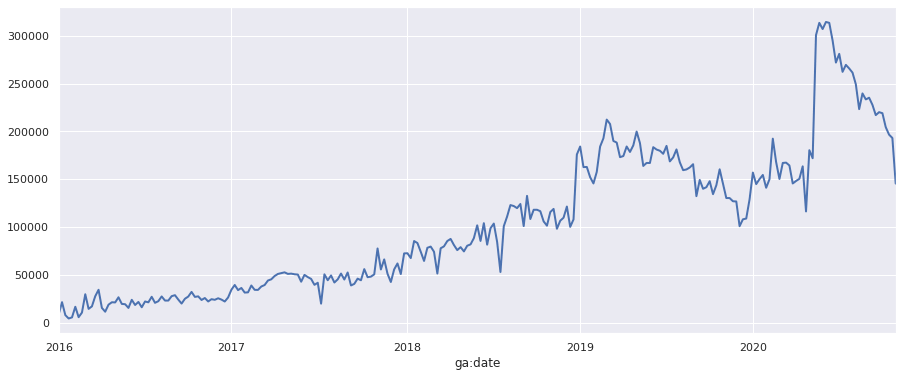
11. Data visualisation
Pandas also lets you perform basic data visualisations to help you better understand your data. Many of these are built in, but you can also use Pandas with larger dedicated data visualisation libraries, such as Matplotlib and Seaborn.
12. Analyse Pandas data using SQL queries
If you’ve come from a SQL background and are finding it hard to work out how to query or filter your Pandas data during EDA, you might be pleased to read that you can even query Pandas data using SQL commands. I took the plunge and learned to do things the Pandas way, but it’s still a handy thing to be able to do if you need to.
Feature engineering and data manipulation
Another powerful part of Pandas is the ability to be able to perform more complex functions on your data to calculate or create new numeric or categorical variables. These can both help you better understand or visualise your data or form part of the feature engineering step when using machine learning approaches.
 Picture by Steve Johnson, Pexels.
13. Apply a function to columns and rows
The apply() function is one you’ll want to learn. It lets you apply a function to columns or rows in a Pandas dataframe, so you can perform a calculation or assign a new value to a column.
14. Binning or bucketing data
Binning or bucketing data through discretization is also a great way to understand data or create new features for models. It basically converts continuous variables to categorical variables by placing data into groups called bins based on their values. It’s widely used in ecommerce and marketing and forms the basis of the popular RFM model.
Working with dates and time series data
Pandas is great for working with times, dates, and time series data and includes loads of handy features for manipulating calendrical and temporal data.
15. Creating date features
Models require numeric values and can’t use dates directly, so you’ll need to create date features that convert a date to a numeric value, such as a day number or year number.
16. Reformatting dates
Since dates can be represented in many different ways, you’ll also commonly need to reformat or convert dates from one representation to another. Pandas makes this fairly simple.
17. Resampling time series data
Resampling is another handy part of Pandas. This lets you group data by day, week, or month, so it’s easier to understand visualise. It’s great for EDA and modeling.
18. Creating custom calendars
Pandas even understands calendars and can be used to identify holidays and business days. You can also create your own country-specific or business-specific calendars, which is great in ecommerce and marketing planning and analysis.
19. Calculating date and time differences
Unsurprisingly, with such rich functionality for manipulating times and dates, you can also calculate time differences in Pandas.
20. Adding and subtracting days from dates
Similarly, you can also add days and subtract days from dates in Pandas to create other dates you can use in your calculations, analyses, or models.
Working with remote data
Pandas isn’t limited to only working with local data stored in a CSV or other file. It can also read remote data and pull it into a Pandas dataframe. Here are a few ways you can achieve this.
21. Reading data from Google Sheets
Via the excellent GSpread package, you can use Pandas to read data from remote Google Sheets and write data back. This is a great way to get external data into your Python application, or push your data back out to share with others.
22. Reading an RSS feed
You can also read remote RSS feeds and pull the data into Pandas. The same approach works for XML, and I use this for analysing XML sitemaps, Google Shopping feeds, and a wide range of other marketing data.
23. Writing data to Google BigQuery
If you work with Google BigQuery you can also use Pandas to connect a local MySQL database to Pandas and then push the data up to BigQuery.
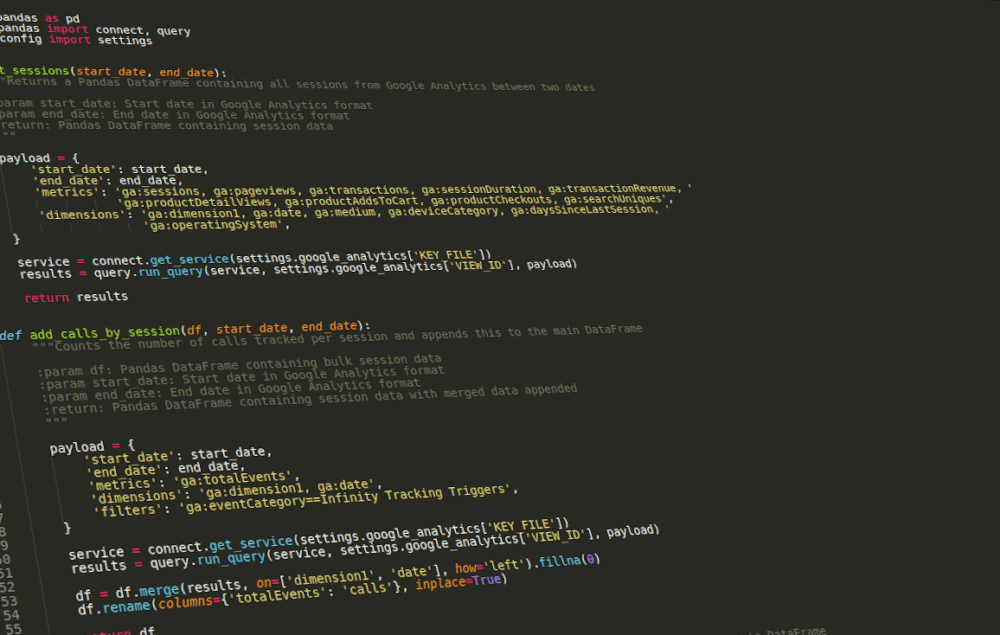
24. Importing data from Google Analytics
Finally, one of the things I find myself doing most at work is analysing Google Analytics data, so much so that I’ve written a couple of Python packages to make this easier. GAPandas lets you query the GA3 or Universal Analytics API and pull data into Pandas, while GA4Pandas does the same for the newer GA4.
- How to use GAPandas to view your Google Analytics data
- How to query the Google Analytics Data API for GA4 using Python
These tutorials don’t cover everything in Pandas, but they’re definitely all you need to get you up and running with the basics. Once you get to grips with the core features of Pandas, you can do almost anything with it.
Matt Clarke, Wednesday, August 24, 2022


Other posts you might like

How to use the Pandas truncate() function
Have you ever needed to chop the top or bottom off a Pandas dataframe, or extract a specific section from the middle? If so, there’s a Pandas function called truncate()...

How to use Spacy for noun phrase extraction
Noun phrase extraction is a Natural Language Processing technique that can be used to identify and extract noun phrases from text. Noun phrases are phrases that function grammatically as nouns...
