A quick guide to customer segmentation for data scientists
Customer segmentation is the process of grouping customers based on shared characteristics in order to aid marketing efforts and guide marketing strategy. Here's how it works.
Customer segmentation is the process of using data science techniques to create discrete groups of customers which share common characteristics or attributes. For example, a company might segment customers into groups based on age, gender, customer loyalty, geographic location, or the products and services customers (or potential customers) use most.
The customer segmentation process allows a company to achieve many things. The most common application is to allow marketers to target marketing campaigns at specific customers to achieve a given marketing goal, such as reactivating lapsed customers or encouraging customers to purchase an additional item.
Customer segmentation also provides the company with powerful data to help focus business strategy and can aid product development by identifying specific groups that may not be catered for by the current product range. The customer or market segmentation can allow a business to effectively reach the right people, target different segments with different products, introduce new products that meet the needs of customers, and identify new segments to target. It’s also a vital part of the lead scoring process.
In this article I’ll cover marketing segmentation strategy, explain the main types of customer and market segmentation, cover the key points from customer segmentation research and explain how you can identify, target and market to the ideal customers.
What are the main types of customer segmentation?
Since customers have so many different attributes, there is a wide range of different types of segmentation techniques, from simple demographic segmentation or behavioral segmentation to more sophisticated techniques that utilise ML.
These aim to look at a huge number of segmentation variables, but they can be grouped into the following main categories, some of which overlap, depending on the nature of the business data. There’s stacks of customer segmentation research available on these methods, they’re generally quite simple to understand and implement, and they work with all marketing strategies.
- Demographic segmentation
- Firmographic segmentation
- Geographic segmentation
- Psychographic segmentation
- Behavioral segmentation
- Value-based segmentation
- Needs-based segmentation
- Product-based segmentation
- Machine-learning-based segmentation
Demographic segmentation
 Picture by Andrea Piacquadio, Pexels.
Customer demographic segmentation is probably the simplest type of customer segmentation. Segmenting the customers demographically doesn’t usually require the creation of segmentation models and the process is as simple as collecting or acquiring demographic information on your customers. Common examples of demographic segmentation include age, gender, education, occupation, income, and marital status.
The theory behind demographic segmentation is that customers of different ages and genders, or with a different marital status, often shop differently and may have different needs, or different values to the business. Therefore, collecting demographic segmentation data (ideally using a process such as progressive profiling, where demographic data are captured occasionally to augment an existing customer profile) or predicting them using a simple model could be useful.
Many companies pay to have their customer base segmented using demographic systems such as Mosaic - a model developed by Experian, which segments customers into 15 groups and 66 types based to create unique customer profiles which tell you how affluent, or not, your customers are, what kind of house they live in, how educated they are, and what sort of jobs they’re likely to have.
Mosaic analysis can be a very interesting way to research and identify the customers a company is reaching. However, I’ve rarely been that convinced that it is of that much practical use in increasing market sales, but is interesting way to understand the customer base, especially if you wish to develop buyer personas. Buyer personas are simply collections of demographic data based on example customers, and can help understand the different groups served and ensure they receive effective communication.
However, Google Analytics can give you some basic demographic variables that may be sufficient to perform a basic analysis of the customer groups who use your products and services and is available free of charge. Others can easily be collected from customers via data capture systems or surveys, without the need to make huge investments that may not deliver an ROI.
Demographic segment examples
| Age | How old is each customer? Ages can be recorded as either a continuous variable or placed into age groups, i.e. 30-39, 40-49 etc. |
| Gender | What gender is each customer? For example, Male or Female. |
| Occupation | What do they do for a living? To reduce granularity, occupations are often grouped into broader categories, i.e. sales, manufacturing, or education. |
| Marital status | Are they single, married, or cohabiting? |
| Family size | How many kids do they have, if any? |
| Employment status | Do they have a regular income from their job? For example, student, unemployed, employed, retired. |
| Education | Education segments usually state the highest education level achieved, i.e. college, or postgraduate. |
| Home ownership | Do they own their own home or rent? |
| Ethnicity | What ethnic background is each customer from? |
| Religion | What religion, if any, do they follow? |
Firmographic segmentation
 Picture by Dimitry Anikin, Unsplash.
Firmographic segmentation is a market segmentation process by which B2B customers are segmented at the company level. In B2B e-commerce environments, the customer’s job title, the company name, the company sector, the company turnover, the number of employees, the registered company number, and the number of sites or branches are commonly used firmographic segmentation variables. All can be very useful to help sales teams or help marketing target customers.
B2B customers will generally be happy to provide their company name, job title, and company number, but you will need to put in some considerable effort if you also want to have their company turnover, the number of employees, the number of sites, and other financial records. You’ll also need to keep these segments updated, as they do change with time. The company sector can be a challenge in its own right because there are many inconsistencies in the ways it can be reported.
In the UK, Companies House provides access to many of these market segmentation variables, and there is a huge range of resellers who can also provide specific firmographic market segmentation data to you for a fee. However, the data aren’t always that reliable, and they may not always be segmented in a consistent manner, or appear in the segment you expect to find them within.
Companies are usually segmented using the Standard Industry Classification (SIC) code system, which assigns a unique reference to the business and places it in a predefined taxonomy, allowing you to target all of the companies in a particular sector. This allows you to approach a data reseller (such as Experian) and request, for example, all of the companies who have a specific SIC code, are of specific company size and have a turnover within your target range.
In B2B e-commerce, a lookalike modeling project is usually undertaken to identify the data acquisition strategy required to generate a return from purchasing the firmographic market segmentation data. Here, a data scientist would undertake an analysis of previously segmented customers and identify correlations between their demographic customer segments and their probability of becoming a more valuable or profitable customer account in the future.
Once you can identify which firmographic segmentation variables can be used to predict which companies are more likely to convert, or more likely to be valuable, you can get your other customers segmented and use this in your segmentation strategy. You can also acquire more business customer data from other potential customers with the same criteria. This can really increase sales performance, as well as help to improve marketing focus.
Related articles
- How to create a dataset containing all UK companies
- How to create targeted B2B company sector datasets
Geographic segmentation
 Picture by Robert Bye, Unsplash.
Geographic segmentation is another simple customer segmentation strategy. This simply segments customers according to their geographical location, usually at a country or county level, but sometimes down to city level, and occasionally as granularly as the latitude and longitude level.
Retailers usually have easy access to geographical data, making the geographic segmentation process very easy to implement. The challenge is typically around how clean the data are, since different customers and sales staff may enter addresses in a variety of formats, making this a major data cleansing task.
To help cleanse customer address data during the geographic segmentation process, there are a number of geocoding tools available, as well as paid data cleansing houses or services that will take your customer geography data, de-dupe it, and correct and normalise the address data held.
These can be used to validate, check, and correct issues with address formatting, as well as calculate the latitude and longitude of addresses. If you have a field sales team, have retail premises, or if you distribute catalogues, then understanding their physical location is going to be a vital part of your marketing segmentation process.
Related articles
- How to geocode and map addresses using GeoPy
- How to create a response model to improve outbound sales
Psychographic segmentation
 Picture by Johann Walter Bantz, Unsplash.
Psychographic segmentation is one of the more sophisticated ways to segment customers but is rarely used in the retail sector as it’s complex and off the radar of most marketers. Rather than looking at behavioral traits, psychographic segmentation looks at psychographic features - psychological traits, such as personality or opinion. It’s been widely used in market research as a form of market segmentation to create customer segments based on conscious or subconscious beliefs, motivations, and various personality traits.
More controversially, psychographic segmentation has been used with uplift modeling to help political parties influence voters. The best-known example of this segmentation strategy was the famous Facebook and Cambridge Analytica scandal which utilised psychographic data obtained from a Facebook survey based on the OCEAN model of personality.
OCEAN aims to ask a series of questions that aim to identify Openness, Conscientiousness, Extroversion, Agreeableness, and Neuroticism. By getting Facebook users to complete an OCEAN survey that looked like many other common Facebook surveys, Cambridge Analytica was able to collect private and not publically disclosed psychographic data and map them to public data from user profiles.
Since the data revealed a correlation between certain public data visible in user profiles to certain private and undisclosed psychographic data, Cambridge Analytica was able to use the process to predict which other users may hold certain political views based on public profile data they could then access through Facebook’s ads platform. That psychographic segmentation strategy allowed them to target political ads, and fake news, at a target market of voters most likely to respond to their psychographic advertising.
Related articles
Behavioral segmentation
 Picture by Campaign Creators, Unsplash.
Behavioral segmentation, unsurprisingly, groups customers according to their behavior. This might be pre-purchase behavior, such as their position within the customer journey, for example, to allow them to be re-targeted if they abandon their basket while shopping online, or it might relate to their purchase behavior or post-purchase behavior, such as how often they shop, how much they spend, how many times they’ve ordered, and how long they usually wait until they place their next order.
In e-commerce, behavioral segmentation allows retailers to target customers according to their precise point in the customer journey. For example, e-commerce purchase intent models aim to examine customer journey data to predict whether customers will purchase during their visit, or shortly afterward. This customer segmentation strategy can be used to generate marketing sales from basket abandonment emails, or by targeting customers with remarketing advertisements via paid search or paid social.
The other common application of behavioral segmentation is to analyse purchase latency - or the gaps between orders. This is known as order gap analysis and it can tell you which of your customers is likely to purchase next, which isn’t due to order for a while, and which customers have probably lapsed.
While this behavioral segmentation strategy has some obvious applications in marketing, in business-to-business settings, purchase latency can help the sales staff target the right customers at the same time. When your salespeople have a limited amount of time to call everyone on their list, the ability to pinpoint those most likely to order can save time and generate money much more effectively.
Related articles
- How to engineer customer purchase latency features
- How to create an ecommerce purchase intention model in Python
Value-based segmentation
 Picture by Brett Jordan, Unsplash.
Value-based customer segmentation is without a doubt my favorite type of segmentation. Not only is it a fascinating customer segmentation method to undertake, but it is also immensely powerful and can add tremendous value to business strategy, marketing activity, and help focus sales efforts.
As the name suggests, this customer segmentation aims to segment customer groups based on their current or potential value to the business. It allows a business to target customers with marketing messages based on customer loyalty so it can deliver promotions to a specific market segment to help increase sales, without needlessly providing promotions and discounts to customer segments who don’t need encouragement to purchase.
It’s also great from a strategic perspective since it allows a sales or marketing team to identify the most valuable customers or companies and give them preferential treatment that may boost marketing sales, help reduce attrition or churn and increase customer retention, boost AOV, or encourage more frequent purchasing.
Related articles
- How to segment customers using RFM and ABC
- How to assign RFM scores with quantile-based discretization
- How to segment your customers using EcommerceTools
Product-based segmentation
 Picture by Hanson Lu, Unsplash.
Product-based segmentation creates customer segments based on the product or service a customer has viewed or purchased, or based on their purchasing behaviour when buying certain items. Product-based customer segmentation has a wide range of applications in retail, powering everything from personalised on-site product recommendations, to targeted marketing or marketing automation emails, and guiding product development.
There’s quite a bit of overlap between product-based customer segmentation and product segmentation, so it’s common for data scientists to perform both analyses together. Typical analyses might examine the product or service a customer purchased, the category they purchased from, the brand purchased, and its price position within the category using the Good, Better, Best (GBB) framework.
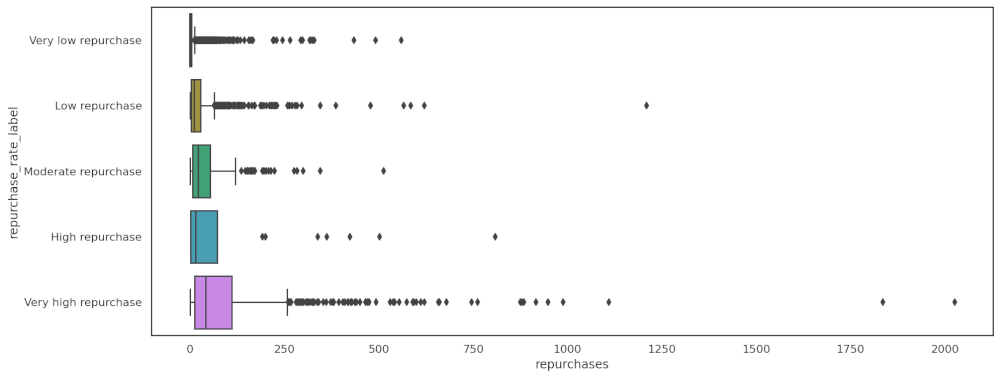
In addition, the product consumption rate and product repurchase rate may be beneficial to identify at the customer level, as well as the product level. For example, certain products might be commonly repurchased (like bread, milk, and beer), while others (for example TVs and laptops) might only ever be purchased once. Similarly, some products are commonly bought in bulk, while others are rarely sold in multiples.
In my experience, the best way to achieve this is via category-level RFM analysis. Here, instead of analysing customers at the business level, you instead calculate an RFM score for each category on your website, generating clearly defined segments that allow meaningful insights to be generated. You get back a detailed picture of the categories where they are most recent and frequent, and where they spend the most money. You can also see which categories no longer float their boat.
Product-based segment examples
| Product purchased | Identifying the product each customer purchased can allow you to target them with replenishent emails, sell recommended extras, or encourage them to upgrade. Due to the large matrices required, this is hard to scale efficiently. |
| Category purchased | Segmenting the customer base by the categories from which they purchase is typically more practical than doing things at the product level, because granularity is significantly reduced, allowing you to create specific campaigns more easily. |
| Brand purchased | Some customers are brand loyal so knowing which brands a customer prefers can help you target them with products they're more likely to like. Similarly, if someone only buys premium brands, they're unlikely to want a budget brand. |
| Good, Better, Best (GBB) | Good, Better, Best (or GBB) product categorisation splits products up into price points based on their value within a product category. Like the brand segment above, GBB segmentation can tell you which price points a customer prefers. |
| Product consumption | Product consumption segments aim to group customers based on their product usage behaviour. For example, does a customer buy individual products in small sizes, or do they buy larger sizes or purchase in bulk. Knowing this can ensure you target them with the right deals. |
| Category RFMH | One technique I've used for over a decade with excellent results is category level RFMH. This is an extension of RFM but looks at the Recency, Frequency, and Monetary value of each customer's purchases within each product category. H stands for Heterogeneity and measures the number of unique SKUs purchased from the category. It's great for targeting customers in seasonal markets. |
Related articles
Needs-based segmentation
 Picture by Chutterstock, Unsplash.
Needs-based customer segmentation (also known as benefit segmentation) is most popular in business-to-business markets and aims to places customers into groups based on their needs or requirements as customers.
For example, in B2B settings you will commonly have customers of various sizes who may have very different needs. Smaller ones might be happy to purchase online and won’t require an account manager, quote management, bespoke products, or anything else out of the ordinary compared to regular B2C e-commerce customers.
However, larger customers may require a purchase order (PO) before ordering, will want to speak to an account manager to haggle over price, might have special requirements for unique or bespoke products, and might need to get quotes from multiple retailers before an order is approved by their procurement team.
Needs-based segmentation attempts to create segments that identify customer needs and identify correlations between the segments and other data held, so the business can offer the right product or service to the right customer according to their unique business requirements.
Machine learning-based segmentation

Machine learning-based segmentation uses the segments from the various other forms of customer segmentation covered above and creates new and distinct groups of customers using clustering algorithms such as k-means. Since models like k-means use the unsupervised learning process of ML, you don’t need to provide labeled training data or define specific groups.
Instead, you just give the k-means segmentation model your previously segmented customer data, tell it the number of clusters to create, and it will automatically assign customers to clusters based on their similarity to each other. It can reveal customer groups you may have not previously have considered during analysis or research.
The actual clusters you get depend entirely upon the customer segments you provide to the model, so you can utilize the technique for almost any form of complex customer segmentation. It’s most commonly used for segmenting customers from behavioral segments, or value-based variables, such as ABC, RFM, and latency.
Since the various other segmentation models generate a high volume of individual segments, it would impractical for marketers to effectively reach target them individually, as the level of campaigns required would be vast. ML based segmentation is therefore a helpful way to reduce some of this granularity by reducing the number of different segments to target so you can provide more effective communication.
Related articles
- How to use k means clustering for customer segmentation
- How to use knee point detection in k means clustering
What customer segments should I create?
While few companies would dispute the importance of customer segmentation to marketing or sales teams, customer segmentation can be complex and time-consuming and is often expensive to implement. Therefore, it’s only worth creating customer segments that are of use to your business or marketing strategy and allow you to target customer segments and increase marketing sales.
While your executive team might suggest you opt for their preferred market segmentation approach, one of the most common mistakes made (especially in small companies) is that marketers blindly accept their recommendation to continue investing in a market segmentation model that may not actually generate results. Before you start building upon the segmentation that already exists, I would recommend your first step should be testing some other types of segmentation and checking to see which method works best.
Often, the most focus tends to be allocated to the creation of marketing segments that are based on data you already hold on your customers since there are little to no costs in acquiring the additional data often required to create psychographic segmentation or firmographic segmentation datasets. However, examination of such segments can show that they actually have few benefits and low predictive power, and your time and money may be better spent creating other variables.
Thankfully, it is relatively straightforward to identify whether your existing customer segmentation data has any predictive value and is of use for market segmentation - a process called customer segmentation analysis.
To perform this consumer data analysis, you’d segment a portion of your existing customers and use a Pearson’s correlation coefficient, or similar statistical measure, to identify whether there is a link between their segments and their likelihood to be a valuable customer.
For example, here’s a Pearson correlation showing the relationship between some of my email marketing customer segments and their impact upon email open rate. There’s a clear relationship between many of these segments, suggesting they have strong predictive power (in this case in predicting open rate, which is in turn correlated to sales). The same technique can be used on other non-value-based segments too.
df[df.columns[1:]].corr()['open_count'][:].sort_values(ascending=False)
open_count                   1.000000
F                            0.863903
RFMLABEL_Star                0.666667
LATENCY_Order overdue        0.666667
M                            0.564565
ABC_CLASS_A                  0.509175
TENURE                       0.256028
LATENCY_Order due soon      -0.111111
RFMLABEL_Hold and improve   -0.111111
LATENCY_Order not due       -0.111111
ABC_CLASS_C                 -0.111111
H                           -0.206725
RFMLABEL_Risky              -0.218218
LATENCY_Not sure            -0.218218
LATENCY_                    -0.218218
RFMLABEL_Loyal              -0.272166
R                           -0.331784
ABC_CLASS_D                 -0.408248
TYPE_customer                     NaN
Name: open_count, dtype: float64
This simple approach can reveal where you should invest your time, effort, and money in building customer segments or procuring additional segmentation data to augment your existing data in order to target customers using these data or target other customers in lookalike segments to allow you to acquire other potentially valuable customers.

What are the most common customer segmentation models?
There are numerous customer or market segmentation models in use in retail today. However, a handful of simple models dominate, because they’re extremely effective, relatively easy to understand, and not too complex to implement.
The majority of commonly used marketing segmentation strategies examine customer loyalty so the most profitable customers can be targeted differently, and customer relationship management (CRM) tools can be used to target segments that are likely to lapse or churn with more aggressive offers you wouldn’t want to give to your best customers who will purchase anyway.
They can also be created using transactional data already held within the business, so are not expensive to introduce or maintain, assuming you have an in-house data scientist at your disposal to undertake the research and carry out the segmentation project.
RFM (Recency, Frequency, Monetary value)
RFM is perhaps the best-known form of behavioral segmentation in marketing. It comes from the catalogue marketing field and was developed to help catalogue marketers maximise the ROI obtained from marketing spend by targeting those most likely to respond and avoiding contacting those less likely to respond. This customer segmentation model works brilliantly and is backed up by decades of business research.
The RFM segmentation model uses transactional data to identify the Recency (R), Frequency (F), and Monetary value (M) of each customer’s orders and assigns a score to them from 1 to 5 for each metric. These scores (or quintiles, as they’re known) are combined to create a single score such as 111 or 555. A higher RFM score generally identifies a customer that is more likely to purchase again in the future.
For example, if you placed one order two years ago and spent £10, you might be assigned an RFM score of 111, indicating that you were not a recent, frequent, or high monetary value customer. On the other hand, if you placed your first order three years ago, have shopped every week, and spent over £2000 during this period, you might be considered one of the best and be assigned a score of 555.
RFM segments, therefore, allow a sales team or marketing team to identify a customer’s behavioral segment from a single number, without the need to do any research or analysis, and they can be immensely powerful in telling you who you should focus upon retaining and who is likely to order again soon. This segmentation model also works brilliantly for email marketing.
ABC segmentation
ABC customer segmentation is based on the Pareto principle or 80:20 rule and originally came from the operations management field, where it was used for inventory management. ABC segmentation takes your customer base, calculates the cumulative revenue for each customer, and allocates customers to segments (or bins) according to the amount of revenue they contribute to the business.
The customers generating the top 80% of the cumulative revenue are assigned to Class A, the customers generating the next 10% of cumulative revenue are assigned to Class B, while the customers generating the final 10% of cumulative revenue are assigned to Class C. I also like to segment customers into an additional Class called D, which contains those who did not order within the target window.
You typically end up with a very small percentage of the customer base in Class A who generate most of your revenue, with a long tail of customers in Classes B and C generating the rest, who make up the bulk of the customer base.
Clearly, you might wish to treat Class A customers differently from those in Classes B or C. Perhaps they get preferential marketing treatment, or account management, to try and keep them happy, since losing them would have a significant impact on the overall company revenue.
Purchase latency
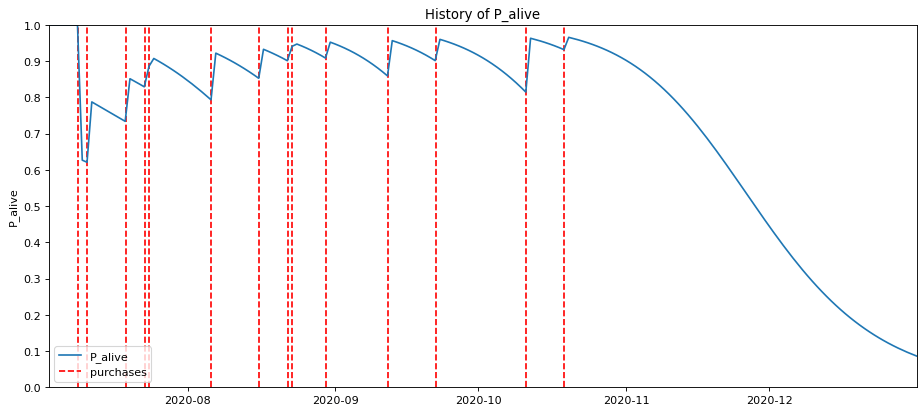
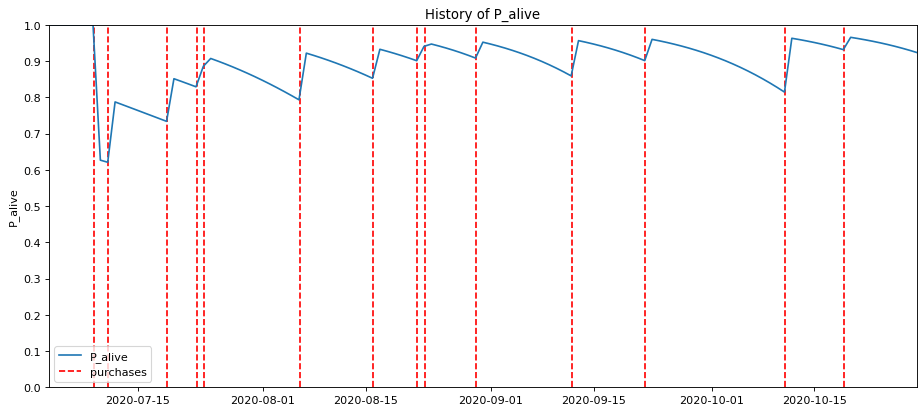
Purchase latency measures the number of days between each of a specific customer’s orders. This metric forms the basis of many Customer Lifetime Value (CLV) models, such as Buy Till You Die (BTYD), and is based on the premise that customers tend to purchase “randomly” somewhere around their mean purchase interval. For example, if a customer has an average latency of 30 days, they might shop every 20-40 days over the course of a year.
The longer the gap between orders, the lower the probability that the customer is still “alive” (in CLV terminology). For example, if our customer who orders every 30 days on average hasn’t been seen for 90 days, there’s a high probability that they’re about to lapse as a customer, so should be targeted with a marketing message or sales call to try to reactivate them and reduce their likelihood to churn.
As a result, you can use purchase latency segments to predict how many of your customers are still customers, which is due to order soon, which isn’t due because they’ve just ordered, and which is lapsed or about to lapse. This is gold dust to a marketing or sales team.
Customer Lifetime Value
Finally, there’s Customer Lifetime Value itself. This is a widely-known segmentation method (sometimes called CLTV). However, despite being well-known it is actually quite complicated to calculate accurately, especially in e-commerce environments, and most retailers don’t really do it properly. By contrast, it’s somewhat trivial in contractual settings.
The main reason why CLV is difficult to calculate in non-contractual settings is that the time of a customer’s death is not explicitly known. Instead, a model is required to predict the probability that each customer is still alive based on their purchase latency. Couple this with the fact that you also need to be able to predict how many orders they’ll place over a given period, as well as how much they’ll spend, and you have quite a challenging research process to overcome in data science terms.
The standard approach for calculating Customer Lifetime Value in non-contractual settings is to create two models. Firstly, you’d build a non-contractual churn model using an algorithm such as Beta Geometric Negative Binomial Bayes Distribution model or BG/NBD, which uses raw RFM metrics to calculate the probability that each customer is alive.
Secondly, you’d calculate the expected number of orders each customer will place within a given period using their purchase latency. While finally, you’d calculate the predicted value of their orders using a model such as Gamma-Gamma. When these are all put together, you get the CLV for each customer based on the number of orders they’ll place (if any), as well as their predicted value.
 Picture by Eric McLean, Unsplash.
What is market segmentation?
The terms market segmentation and customer segmentation are often used interchangeably, however, market segmentation is usually considered to be the process of dividing the overall market or business into segments, rather than the process of assigning the underlying customers to these segments.
The overall aim of the market segmentation process is to find “high yield” market segments that are more responsive, more profitable, or more likely to increase marketing sales than others within the target market when targeted.
Marketers use the assumption that each segment is likely to respond best to tailored messaging. During this kind of market segmentation project, marketers will typically adopt the STP marketing framework (Segmentation, Targeting, Positioning) to first segment the market, second identify the high yield segment they wish to target and then position their specific product or service and marketing messages directly at that market segment.
Market segmentation offers the opportunity to maximise marketing sales and ROI. Simply segment the customers within the market, identify how the customer segments are correlated with sales, conversion, or profit, and then create specific marketing campaigns to target these customers. This approach is different from undifferentiated segmentation, whereby a company markets its products to appeal to everyone in the market rather than a specific segment.
Market segmentation strategies
In the market segmentation process there are four main strategic approaches:
| Undifferentiated | An undifferentiated market segmentation strategy contains no segments that are specifically targeted, and instead appeals to the masses. |
| Focus | Focus market segmentation strategy targets marketing efforts on a very specific segment of customers within the market. |
| Differentiated | Differentiated market segmentation strategy targets two or more niches within a target market and is tightly defined. |
| Hypersegmentation | Hypersegmentation strategy uses one-to-one personalised marketing to target individuals. This is uncommon and hard to implement. |
Matt Clarke, Sunday, May 30, 2021


Other posts you might like

How to use the Pandas truncate() function
Have you ever needed to chop the top or bottom off a Pandas dataframe, or extract a specific section from the middle? If so, there’s a Pandas function called truncate()...

How to use Spacy for noun phrase extraction
Noun phrase extraction is a Natural Language Processing technique that can be used to identify and extract noun phrases from text. Noun phrases are phrases that function grammatically as nouns...
